


The Big Idea
A sticky situation
Stephen Stanley | July 29, 2022
This document is intended for institutional investors and is not subject to all of the independence and disclosure standards applicable to debt research reports prepared for retail investors.
Inflation has accelerated and broadened this year to a much wider set of goods and services. The Dallas Fed Trimmed-Mean PCE index gets lots of attention as a window on the breadth and persistence of inflation. But another measure with a unique view is the Atlanta Fed’s Sticky-Price CPI. The Atlanta Fed’s take on inflation suggests it is putting down deeper roots in the economy and will require significant additional Fed tightening to trim it back.
Sticky-Price CPI
Economists define a price of a given good or service as sticky if it does not change frequently. For some businesses, there are significant costs to changing prices, so they tend to only change prices on occasion. Coin-operated laundromats would be one example. Other prices are more flexible and move around all of the time. The most familiar example of flexible pricing would be gasoline.
To the extent that some firms face significant costs to change their prices, the theory is that a price hike or cut will only be made if the company expects the shifting forces pushing it toward a price change to persist for a substantial period of time.
A pair of economists published an academic paper in 2004 where they scoured through all of the categories of the CPI and determined how frequently prices changed in each component. Building on this research, economists at the Atlanta Fed divided the 45 major categories of the CPI into those that change prices frequently—“flexible-price” goods and services—and those that change less often—“sticky-price” goods and services.
The Atlanta Fed researchers drew the line at 4.3 months. Categories that change prices more frequently were considered flexible and those that shifted less frequently were considered sticky. By that definition, about 70% of the CPI by weight reflects sticky price categories, while the rest falls in the flexible bucket. Roughly half of flexible-price categories by weight were in food and energy. Within the core, flexible categories were mainly autos, apparel and hotel rates, categories roughly corresponding to the Fearsome Five that I often refer to in CPI write-ups. The sticky-price aggregate is heavily weighted toward services, including shelter costs, medical services, education, and personal care services.
The Atlanta Fed researchers then examined the flexible-price and sticky-price CPI measures relative to economic performance. They found, not surprisingly, that the flexible-price CPI tended to be more closely correlated to the degree of economic slack. They also found that the sticky-price CPI did a better job of predicting future inflation than the headline CPI. Moreover, the longer the time horizon of the inflation forecast, the larger the improvement of the sticky-price gauge over the traditional headline CPI. They determined that this reflected the fact that sticky-price CPI movements tell us a great deal about firms’ inflation expectations. Since they face high costs to making a change to prices, a “sticky-price” business would only do so if it expected the need for higher prices to persist for some time. The Atlanta Fed’s Sticky-Price CPI gauge consequently offers insight into how persistent inflation might be.
What does sticky-price CPI say about the current situation?
A look at the Flexible-Price and Sticky-Price CPI measures on a 12-month change basis over the past 10 years shows clearly that the surge in inflation in 2021 occurred almost exclusively in flexible-price categories. As of June 2021, which encompasses the first big spike in headline and core inflation, the 12-month change in the Sticky-Price CPI measure had only accelerated to 2.7%, while the Flexible-Price gauge had surged to 13.8% (Exhibit 1)
Exhibit 1: Sticky-Price vs. Flexible-Price CPI
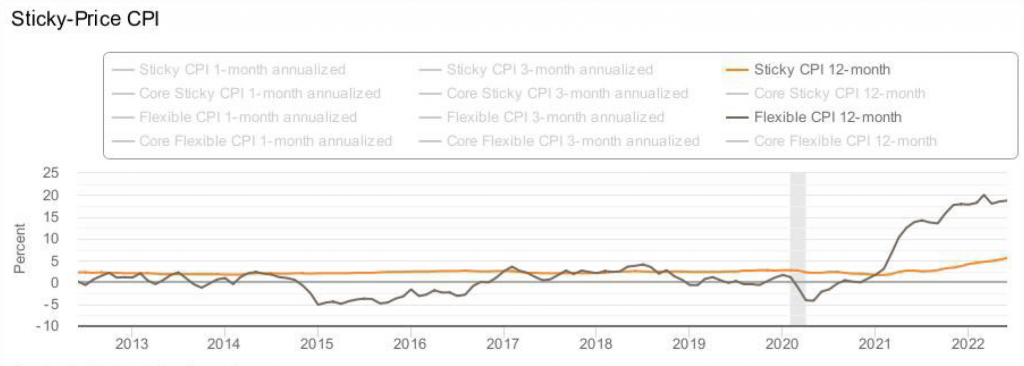
Gray bars indicate periods of recession.
Source: Federal Reserve Bank of Atlanta
Moving forward to this year, the Flexible-Price CPI gauge has remained extremely high (18.7% as of June), due to a significant degree to the surge in gasoline prices. However, the more troubling development is that the Sticky-Price CPI measure began to take off late last year and has accelerated sharply in the first half of 2022, reaching 5.6% in June.
The steady acceleration in the Sticky-Price CPI corroborates the evolving inflation picture that we see daily in the press and everyday life. Each day that the public sees high inflation raises the perceived likelihood that prices will continue to move up rapidly because people are growing accustomed to high inflation. Businesses that might ignore short-term swings in their costs in a stable price environment have begun to raise their prices more because they perceive that inflation may continue to be elevated.
The prevailing view currently in the financial markets is that the economy is turning down and that inflation will cool quickly in response. This may be true for many flexible prices. We are already seeing a moderation, for example, in gasoline prices. However, the rapid acceleration in the Sticky-Price CPI gauge, which covers 70% of the overall CPI and an even higher proportion of the core CPI, over the last six to 12 months suggests that inflation will prove more persistent, forcing the FOMC to work harder to bring price increases back to its 2% target than current market pricing implies.