


The Big Idea
Broad and fast inflation
Stephen Stanley | October 21, 2022
This document is intended for institutional investors and is not subject to all of the independence and disclosure standards applicable to debt research reports prepared for retail investors.
The most disturbing aspect of the last two CPI reports was the overwhelming breadth of price increases. Rather than reflecting a narrow base of volatile categories, as was the case in the spring of 2021, the rapid increase in inflation in 2022 has come from a wide array of categories, including those that tend to be quite persistent. This alignment may mean that inflation will be slower to moderate than the Federal Reserve and most economists project.
Trimmed mean and median CPI
The Cleveland Fed parses the CPI data in two interesting ways. Researchers rank the line items by the pace of inflation, using the relative importance for each category to weigh the contributions. This allows them to calculate two different indices: a trimmed-mean index and a distinct median index.
First, the trimmed-mean index lops off the categories that constitute the bottom 8% of the index and the top 8% at any point in time based on the rankings by rate of change. Conceptually, this is similar to core inflation, but instead of arbitrarily assuming that only food and energy products and services are volatile, the trimmed-mean calculation allows the data to dictate which line items are outliers. The presumption is that the middle 84% of the index is a better representation of underlying inflation trends than either the headline or the core index, both of which can be pushed around by sharp temporary moves in volatile categories such as used vehicle prices, for example.
Second, the ranking process can be tracked all the way to the middle. The Cleveland Fed’s median CPI is the one-month, or 12-month, inflation rate of the single component that is in the 50th percentile of price changes.
There are a few striking developments to point out in comparing the Cleveland Fed’s inflation measures to the headline and core CPI. First, while the CPI has decelerated in recent months, mainly reflecting the pullback in gasoline prices, and core CPI is running only slightly above its February and March readings, the trimmed-mean and median CPI measures have continued to accelerate significantly and consistently (Exhibit 1). This speaks to the broadening aspect of the inflation problem.
Exhibit 1: Year-over-year inflation by different measures
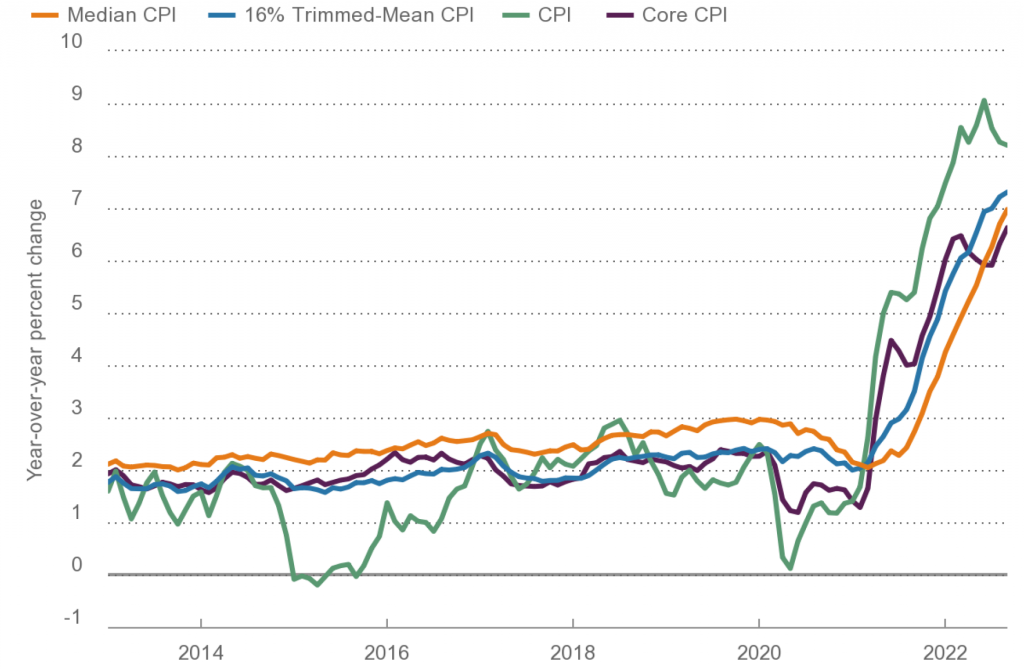
Source: BLS, Cleveland Fed, Haver Analytics
Second, for about a year, from early 2021 to early 2022, the core CPI was running well in excess of the trimmed-mean and median CPI gauges. This reflected the fact that core inflation was being boosted by some of the more volatile categories, such as vehicle prices and airfares. That alignment has now flipped. Even with the noticeable acceleration in the year-over-year core CPI inflation rate in August and September, both the trimmed-mean and median CPI measures are now running well above core CPI. The September reading for year-over-year core CPI rose to 6.6%, a new 40-year high, but the trimmed-mean and median CPI indices were even worse, 7.3% and 7.0%, respectively. What this means is that, as I have pointed out in recent CPI recaps, the noisy categories within the core, such as airfares and used vehicle prices, are actually dragging inflation down at the margin, the opposite of what took place in 2021.
Distribution of Component Price Increases
The Cleveland Fed ranking calculations used to calculate these indices offer confirmation of the sense that high inflation is broad. In September, the trimmed-mean CPI jumped by 0.6% (same as the core CPI) and the median CPI surged by 0.7%. The ranking of the individual components show that 16.5% of the index posted negative readings in September, highlighted by gasoline prices (which have about a 5% weight) and used vehicles (roughly a 4% weight).
The striking element of the September rankings is a hollowing out of the modest inflation range. Last month, less than 10% of the index by weight posted a one-month annualized inflation rate of 0% to 3% (prior to the pandemic, that range would have incorporated most of the overall index). Meanwhile, 45% of the index by weight posted a one-month inflation rate of 5% to 10%, while nearly 20% was up by more than 10%.
The Dallas Fed conducts a similar exercise for the PCE deflator, calculating a trimmed-mean index. The PCE deflator generally tends to run somewhat lower than the CPI, but the distribution of price increases is similarly troubling (Exhibit 2). Similar to the CPI data from the Cleveland Fed, the PCE distribution shows a hollowing out of the 0% to 3% range. In August (the last available data), just over 20% of the weight of the index was negative (including gasoline, used vehicles, and a handful of other sizable categories). However, only 12.5% of the weight of the index posted an annualized increase of 0% to 3%. More troublingly, almost 60% of the index jumped at more than a 5% annualized clip, including nearly 30% that rose faster than a 10% pace.
Exhibit 2: The evolving distribution of PCE component prices
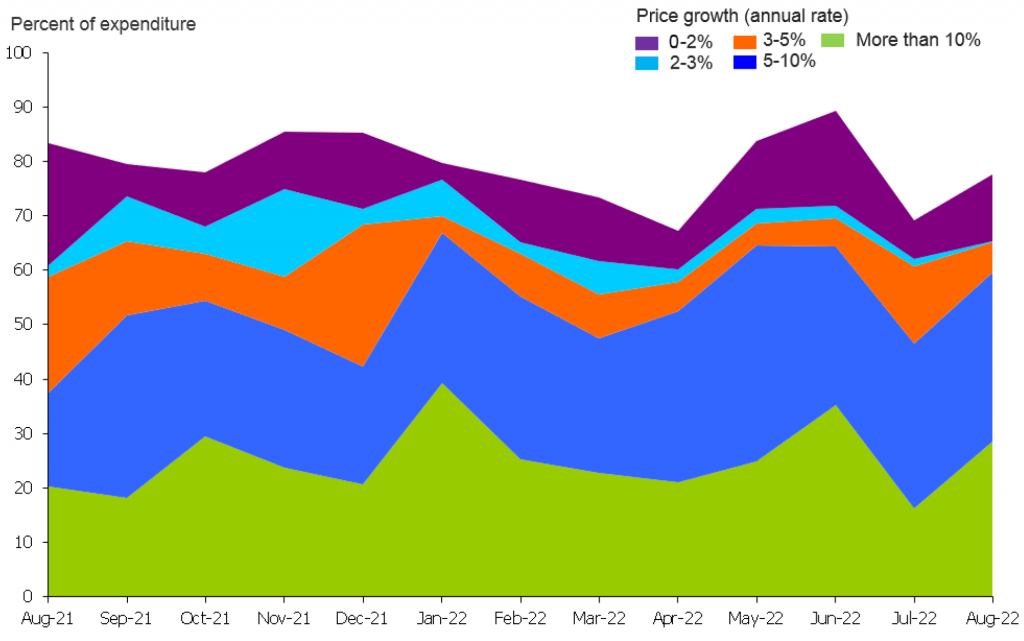
Source: Dallas Fed.
This means that the inflation problem is not idiosyncratic. Getting relief on a single item will do little to resolve the generalized inflation problem. For example, a good argument can be made that, with the housing market cooling sharply, shelter costs are likely to decelerate noticeably, beginning some time in 2023. If shelter costs were the main or only driver of high inflation, it might make sense for the Fed to look forward and have confidence in a decisive moderation in price hikes. However, to the extent that inflation has many drivers these days, the Fed will need to attack the root of the problem (an overheated economy and, in particular, an overheated labor market) rather than cross their fingers and hope for relief in a few individual categories.