The Long and Short
Finding value in ‘A’ credit
This document is intended for institutional investors and is not subject to all of the independence and disclosure standards applicable to debt research reports prepared for retail investors.
The incremental yield available in moving from ‘AA’ to A’ credit is currently at historic highs and greater than moving from ‘A’ to ‘BBB’. That points to relative value in ‘A’ risk. One clear opportunity is to underweight Cisco Systems Inc. (CSCO – A1/AA-) and overweight Booking Holdings Inc. (BKNG – A3/A-). Both credits have strong net cash positions, providing for a ratings cushion should the economy go into recession.
The spread differential between the two credits in the 4-year part of the curve currently stands at 67 bp, exceeding the average pick-up of 54 bp to move down the ratings curve (Exhibit 1).
Exhibit 1. CSCO to BKNG LTM Comparison
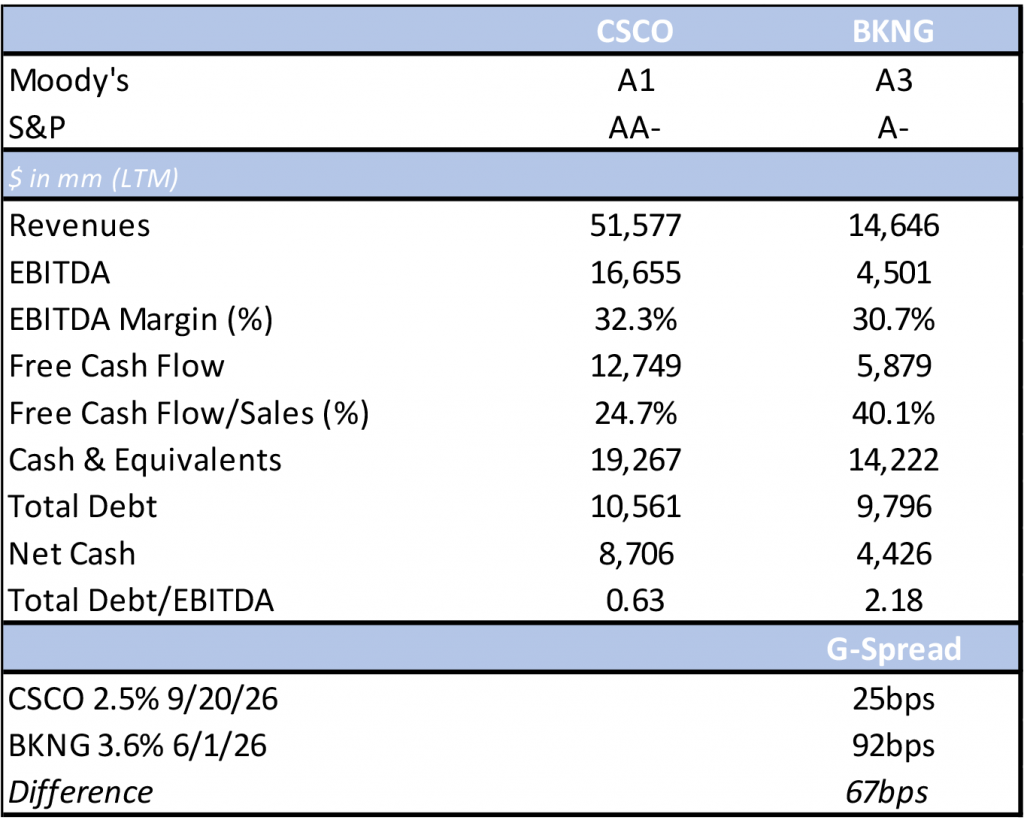
Source: Company Reports; Bloomberg; APS
Cash is King
The trade idea largely revolves around the strong cash positions of both credits, which is fueled by their strong free cash flow generation. A net cash position is positive in a rising rate environment as it helps to alleviate the need to tap the public debt market at disadvantageous interest rates. Furthermore, it provides each credit with some ratings cushion in a macroeconomic downturn. While CSCO’s cash position is larger than BKNG’s (by roughly $5bn), BKNG benefits from a higher free cash flow/sales ratio. BKNG’s business is slightly less capital intensive that that of CSCO as BKNG’s capital intensity ratio stands at $1.67, versus $1.82 at CSCO. This enables BKNG to maintain a higher free cash flow/sales ratio, which is over 15 percentage points higher than CSCO’s.
Additionally, BKNG ended 2019 with cash and equivalents of $11.8 billion. While the company issued debt in 2020 to shore up liquidity, we note that it has repaid most of that debt while expanding its cash position nearly $2.5 billion. CSCO ended calendar 2019 with a cash position of approximately $27 billion and total debt of roughly $17 billion. CSCO’s cash now stands at $19.3 billion while total debt has been reduced by $6.5 billion over the same time period (Exhibit 1).
More Conservative Financial Policies Support BKNG
While both companies have witnessed deterioration in their stock performance this year, BKNG’s stock is down just over 26% year-to-date, relative to 34% at CSCO (at time of writing). However, CSCO has been more aggressive with shareholder remuneration relative to BKNG. While BKNG does not pay a dividend, the company returned 39% of free cash flow to shareholders via repurchases, on a LTM basis. CSCO, on the other hand, was unable to keep shareholder rewards within the confines of free cash flow. CSCO spent $14.6 billion on buybacks and dividends, despite only generating $12.8 billion in free cash flow. Management maintains a stated capital return policy of returning 50% or more of free cash flow to shareholders. Over the past 10 years, CSCO has returned an average of 102% of free cash flow to shareholders, versus 75% at BKNG.
Outlooks are Stable
Both BKNG and CSCO have stable outlooks on their ratings. BKNG’s stable outlook reflects the expectation for continued recovery in travel demands. We note that 2Q22 marked BKNG’s first quarter to exceed pre-pandemic revenue levels, with that quarterly trend expected to continue for the remainder of the year. Additionally, consensus estimates have BKNG generating $5.0bn of free cash flow for the year, relative to the $4.5bn generated in 2019.
CSCO’s stable outlook reflects the expectation to generate stable revenue and free cash flow through the current economic downturn while maintaining a net cash position. Should management become more aggressive with their financial policy by further increasing shareholder remuneration or by pursuing large M&A transactions that would push leverage into the 1.0x-2.0x area, the agencies would reconsider their current ratings. Given that CSCO has paid down debt over the past five years, leverage is comfortably below 1.0x. CSCO would need to increase debt by over $7 billion to bring leverage just over 1.0x.
This material is intended only for institutional investors and does not carry all of the independence and disclosure standards of retail debt research reports. In the preparation of this material, the author may have consulted or otherwise discussed the matters referenced herein with one or more of SCM’s trading desks, any of which may have accumulated or otherwise taken a position, long or short, in any of the financial instruments discussed in or related to this material. Further, SCM may act as a market maker or principal dealer and may have proprietary interests that differ or conflict with the recipient hereof, in connection with any financial instrument discussed in or related to this material.
This message, including any attachments or links contained herein, is subject to important disclaimers, conditions, and disclosures regarding Electronic Communications, which you can find at https://portfolio-strategy.apsec.com/sancap-disclaimers-and-disclosures.
Important Disclaimers
Copyright © 2024 Santander US Capital Markets LLC and its affiliates (“SCM”). All rights reserved. SCM is a member of FINRA and SIPC. This material is intended for limited distribution to institutions only and is not publicly available. Any unauthorized use or disclosure is prohibited.
In making this material available, SCM (i) is not providing any advice to the recipient, including, without limitation, any advice as to investment, legal, accounting, tax and financial matters, (ii) is not acting as an advisor or fiduciary in respect of the recipient, (iii) is not making any predictions or projections and (iv) intends that any recipient to which SCM has provided this material is an “institutional investor” (as defined under applicable law and regulation, including FINRA Rule 4512 and that this material will not be disseminated, in whole or part, to any third party by the recipient.
The author of this material is an economist, desk strategist or trader. In the preparation of this material, the author may have consulted or otherwise discussed the matters referenced herein with one or more of SCM’s trading desks, any of which may have accumulated or otherwise taken a position, long or short, in any of the financial instruments discussed in or related to this material. Further, SCM or any of its affiliates may act as a market maker or principal dealer and may have proprietary interests that differ or conflict with the recipient hereof, in connection with any financial instrument discussed in or related to this material.
This material (i) has been prepared for information purposes only and does not constitute a solicitation or an offer to buy or sell any securities, related investments or other financial instruments, (ii) is neither research, a “research report” as commonly understood under the securities laws and regulations promulgated thereunder nor the product of a research department, (iii) or parts thereof may have been obtained from various sources, the reliability of which has not been verified and cannot be guaranteed by SCM, (iv) should not be reproduced or disclosed to any other person, without SCM’s prior consent and (v) is not intended for distribution in any jurisdiction in which its distribution would be prohibited.
In connection with this material, SCM (i) makes no representation or warranties as to the appropriateness or reliance for use in any transaction or as to the permissibility or legality of any financial instrument in any jurisdiction, (ii) believes the information in this material to be reliable, has not independently verified such information and makes no representation, express or implied, with regard to the accuracy or completeness of such information, (iii) accepts no responsibility or liability as to any reliance placed, or investment decision made, on the basis of such information by the recipient and (iv) does not undertake, and disclaims any duty to undertake, to update or to revise the information contained in this material.
Unless otherwise stated, the views, opinions, forecasts, valuations, or estimates contained in this material are those solely of the author, as of the date of publication of this material, and are subject to change without notice. The recipient of this material should make an independent evaluation of this information and make such other investigations as the recipient considers necessary (including obtaining independent financial advice), before transacting in any financial market or instrument discussed in or related to this material.


