


The Big Idea
Record foreign buying of US debt, modest impact
Steven Abrahams | September 9, 2022
This document is intended for institutional investors and is not subject to all of the independence and disclosure standards applicable to debt research reports prepared for retail investors. This material does not constitute research.
Foreign private investors have poured a record amount of capital into US debt this year, concentrating their flows in the US Treasury market. The flows come despite generally poor carry in the trade, suggesting high value to those investors for Treasury safety and liquidity. The flows bear the mark of investors concerned about volatility in their own domestic markets. With an energy crisis unfolding in Europe, those concerns only look likely to build. But foreign private investors’ modest share of the outstanding Treasury market likely means their flows will only have modest impact for now.
Net foreign private inflows hit a record
Net flows into US long-term debt from foreign banks, insurers, funds and other private portfolios have hit record levels this year. From January through June, foreign private portfolios added $591 billion in exposure, the highest 6-month tally ever recorded by the Treasury International Capital System (Exhibit 1). The private buying stands in contrast to the appetite of foreign central banks and other official government accounts, where net buying through June totaled only $45 billion.
Exhibit 1: Foreign private flows into US debt have hit records levels in 2022
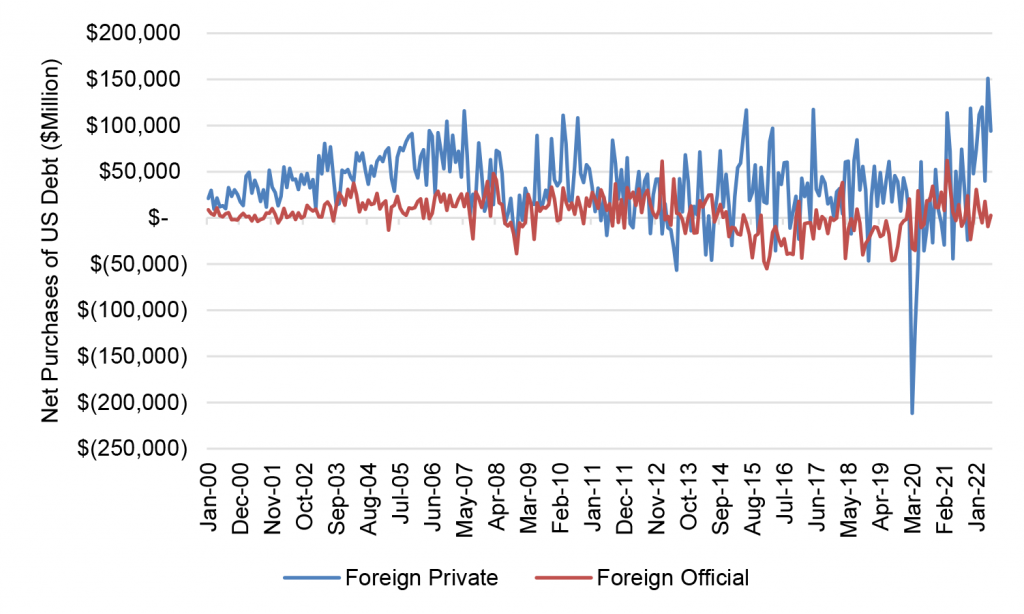
Note: Data shows net purchases of long-term debt.
Source: Treasury International Capital System, Amherst Pierpont Securities
Most of the demand is for Treasury debt
The vast majority of the foreign private buying is coming in US Treasury debt. Of the $591 billion added January through June, $445 billion came in Treasury debt, $58 billion in agency MBS and debt and $88 billion in corporate and securitized debt (Exhibit 2).
Exhibit 2: More than 75% of net foreign private buying has come in Treasury debt
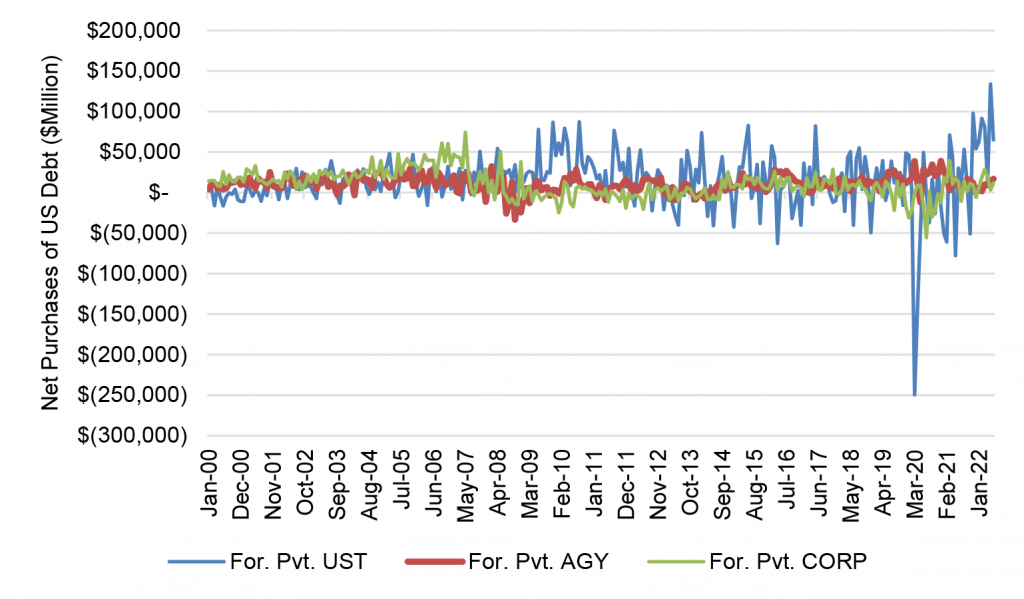
Note: Data shows net purchases of long-term debt.
Source: Treasury International Capital System, Amherst Pierpont Securities
The demand comes despite poor carry in the trade
The buying of Treasury debt has continued despite high net cost to foreign investors. One easy way to see that is to look at current economics for a domestic German portfolio choosing to invest in US 10-year notes. The German investor could go to the foreign exchange market and exchange 99.56 million euros for 100 million dollars (Exhibit 3). The forward markets will allow the German investor to hold the dollars for three months and then either roll the contract for another three months or repay. For each 3-month period, the forward market charges an annualized interest rate on the dollars of 2.395%. Since the 10-year note yields an annualized 3.29%, the investors take out 0.895% in net carry. However, if the investor had simply kept the funds in 10-year bunds, the annualized coupon would be 1.707%. Investing in US debt consequently costs the investor more than 81 bp in carry. That does not consider differences in price action during the 3-month period, but the cash flow returns to the trade on Day One are negative.
Exhibit 3: The cost of going from German to US 10-year debt
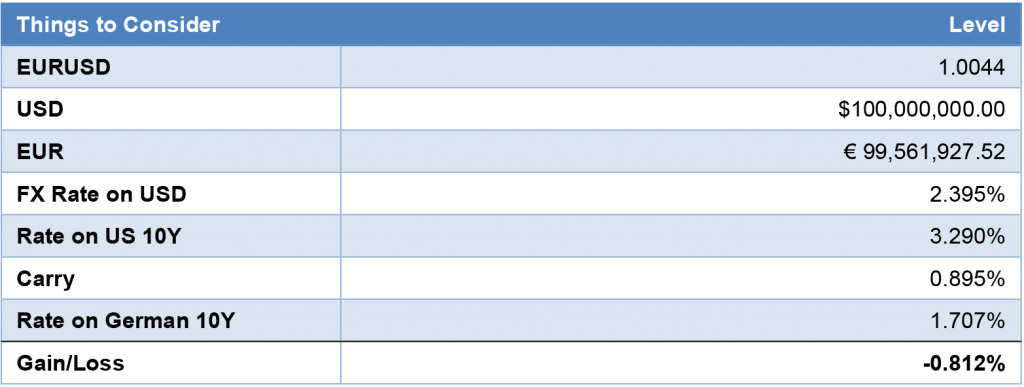
Note: all market levels as of 8 Sep 2022, 3:30p ET.
Source: Bloomberg, Amherst Pierpont Securities.
A German investor would not be alone in facing high costs to go from domestic to US debt. In the eurozone or Switzerland, for example, whether going into 2- or 10-year US debt or nearly any other maturity, the current carry P&L from US debt falls short of the carry in the investors’ domestic market (Exhibit 4). Only by going from Japanese 2-year debt into US 2-year debt does an investor pick up carry, and only 8 bp.
Exhibit 4: Trading from domestic into US debt costs foreign investors in carry
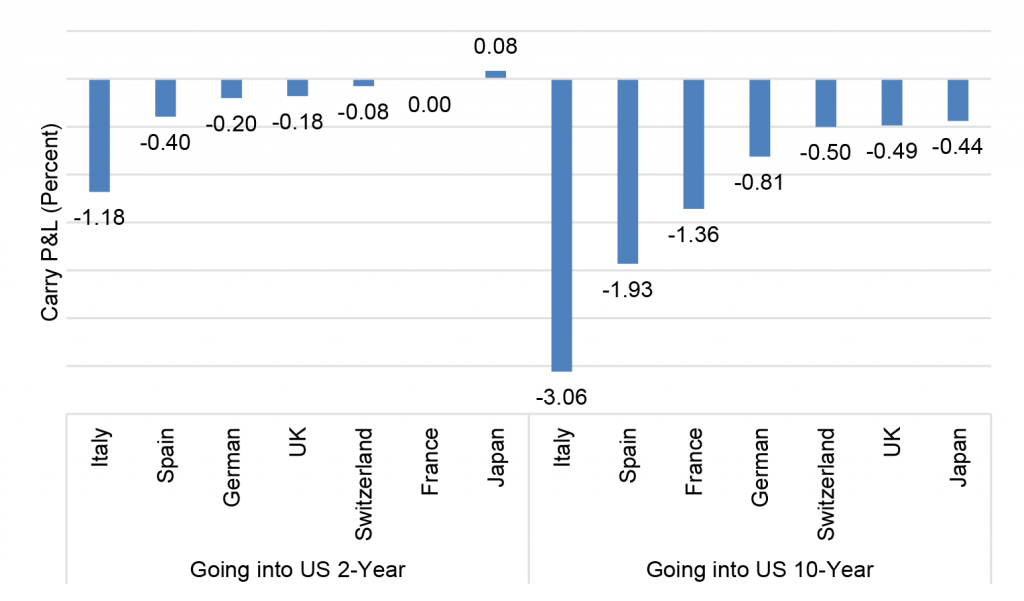
Note: Analysis assumes the investor sells domestic 2- or 10-year debt, converts proceeds into US dollars using 3-month foreign exchange forward contracts and converts back to domestic currency at 3-month maturity. Constant prices assumed. All market levels as of 8 Sep 2022, 3:30p ET.
Source: Bloomberg, Amherst Pierpont Securities.
A bid for safety and liquidity
Heavy foreign private flows into US Treasury debt despite the current initial cost in carry speaks to the value of other attributes of the market, namely US Treasury safety and liquidity. That value is likely to rise through the winter in light of pressures on European energy markets and ripple effects globally. Europe is facing record prices for natural gas and electricity and the prospect of industrial shutdowns if energy-intensive manufacturers cannot pass along their costs. Governments in Europe and the UK are trying to cushion the impact with a combination of windfall profits taxes, effective price caps, subsidies and implicit rationing. The fiscal costs stand to be significant. And even though the G-7 is trying to cap the price of Russian oil while keeping it flowing, a decision by Russia to cut off G-7 and eurozone countries and sell the oil elsewhere on the global market could push oil back towards its peak pricing of earlier this year.
Modest initial market impact
The immediate effect of continuing foreign private buying is likely to be limited. Foreign private portfolios currently only hold 12.9% of the market value of outstanding marketable Treasury debt, up from 11.9% in January (Exhibit 5). The share still is well short of the levels built up by foreign central banks and other official portfolios during the 2000s, when those portfolios were awash in currency reserves. Only if global volatility continues and foreign private portfolios begin to build up a steadily larger share of the outstanding Treasury market will those flows have the potential to lower US Treasury rates. In the meantime, foreign flows into the Treasury market are likely to continue, at the very least easing some of the liquidity strains that have built up in the market this year.
Exhibit 5: Foreign private share of Treasury debt is rising but still modest
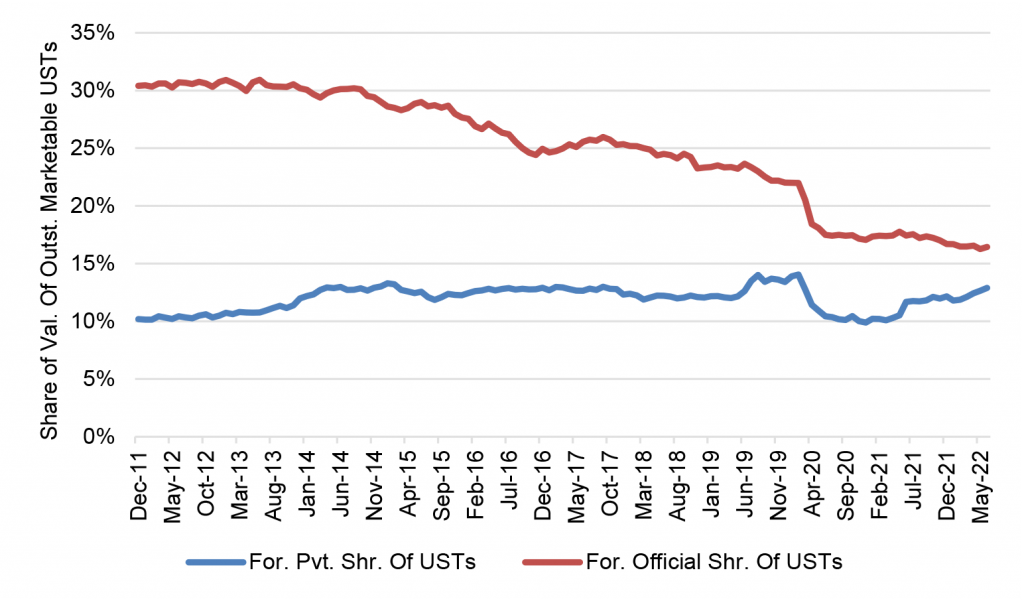
Note: data show TICS holdings as a share of the market value of outstanding US Treasury debt. Source: TICS, Federal Reserve.
Special thanks to Michael Egleston for analysis of the carry costs of investing in US debt.
* * *
The view in rates
The 2-year note closed Friday at 3.56%, up 16 bp from a week ago. It is getting closer to fair value. The 10-year note closed well beyond fair value at 3.31%. The 2-year rate remain above 3.50% as the market begins to appreciate a Fed more concerned about inflation than recession. Fair value at 10-year and longer maturities still looks anchored between 2.50% and 3.00%, the difference depending on expected persistence of inflation, and that should steadily draw 10-year yields lower. But the possibility of a sustained fight with inflation may require compensation above fair value even in long maturities. The 2s10s curve looks likely to invert by around 70 bp before Fed tightening is over.
Fed RRP balances closed Friday at $2.21 trillion, solidly in the range since mid-June. Yields on Treasury bills into early October continue to trade below the current 2.30% rate on RRP cash. Money market funds have little alternative but to put proceeds into RRP.
Settings on 3-month LIBOR have closed Friday at 324 bp, wider by 20 bp on the week. Setting on 3-month term SOFR closed Friday at 316 bp, wider by 25 bp.
Breakeven 10-year inflation finished the week at 243 bp, down 15 bp from a week before. The 10-year real rate finished the week at 88 bp, higher by 46 bp.
The Treasury yield curve has finished its most recent session with 2s10s at -25 bp, steeper by 10 bp on the week. The 5s30s finished the most recent session at 1 bp, unchanged on the week.
The view in spreads
Jackson Hole had the potential to help resolve the disconnect between Fed rhetoric on continued tightening and the path of fed funds implied in forward rates through most of the summer—the path where the Fed tightens into early 2023 and then begins to ease. But the market has only raised its estimate of terminal fed funds and has kept the implied ease. Volatility should continue while the tension between policy and market holds. Both MBS and credit have widened since Jackson Hole. MBS should start outperforming again. Nominal par 30-year MBS spreads to the blend of 5- and 10-year Treasury yields finished the most recent session at 144 bp, wider by 8 bp on the week. Par 30-year MBS OAS finished the week at 32 bp, wider by 4 bp on the week. Investment grade cash credit spreads have tightened on the week by 3 bp and stand at 164 bp over the SOFR curve.
The view in credit
Credit fundamentals have started to soften with the weakest credits showing slower revenue growth so far in 2022, declining free operating cash flow and less cash on the balance sheet. Ahead lays weaker demand, margin pressure, a soft housing market and various risks from Covid and supply interruptions. Inflation will land differently across different balance sheets. A recent New York Fed study argues inflation generally helps companies lift gross margins, although airlines and leisure may have an easier time passing through costs than healthcare, retail and restaurants. In leveraged loans, a higher real cost of funds would start to eat away at highly leveraged balance sheets with weak or volatile revenues. Consumer balance sheets look strong with rising income, substantial savings and big gains in real estate and investment portfolios. Homeowner equity jumped by $3.5 trillion in 2021, and mortgage delinquencies have dropped to a record low. But inflation and recession could take a toll and add credit risk to consumer balance sheets.