


The Long and Short
Corporate Outlook 2022: Strong issuance and demand for yield, shifting inflation and the consumer
Meredith Contente and Dan Bruzzo, CFA | November 19, 2021
This document is intended for institutional investors and is not subject to all of the independence and disclosure standards applicable to debt research reports prepared for retail investors.
Strong issuance. Steady demand for yield. Robust M&A. A weaker consumer. An imprint from inflation on companies and their customers. And credit picking comes back into play. These are some of the things likely to mark the investment grade corporate market next year. And investors have a wide range of relative value opportunities to choose from in positioning for some of these developments.
* * *
Gross and net new issue volume should only drop modestly in 2022
In last year’s outlook, we predicted gross new issuance would drop from a 2020 record of $1.9 trillion to a high but more normal range of $1.5 trillion to $1.6 trillion. With roughly six weeks left in the year, issuance should hit the lower end of that range. Street projections for next year are likely to show a substantial drop. For the five years before issuance surged during pandemic, investment grade new issuance had averaged around $1.3 billion a year. We suspect many Street estimates will calling for a return to this level of activity. But for 2022, we expect gross issuance to drop by only 5% to about $1.425 trillion.
Exhibit 1: Gross issuance in 2022 should drop 5% go $1.425 trillion
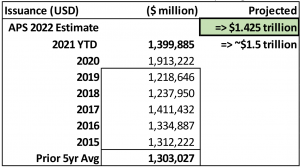
Source: Amherst Pierpont, Bloomberg LEAG Tables as of 11/16.21
Even though gross supply should drop, net supply should stay near the levels of the last two years. More debt proceeds are likely to be used for M&A, shareholder renumeration and purposes other than early debt redemption, we expect that the net supply will remain close to the levels achieved in the prior two years. Corporate management teams have been very aggressive in using accommodative debt markets to address upcoming debt maturities over the past several years, pushing further and further out the maturity curve. They have also implemented debt tenders to address less efficient tranches in their respective capital structures. Those efforts show in the declining balance of maturities over the upcoming three years, at least compared to recent benchmarks (Exhibit 2). While early debt retirement will remain the primary use of debt proceeds going forward, corporate balance sheets should be able to take on new aggregate debt in the form of collective corporate leverage, which again would offset a lower gross total of debt being issued.
Exhibit 2. The 3-year total of upcoming maturities has declined from 2019
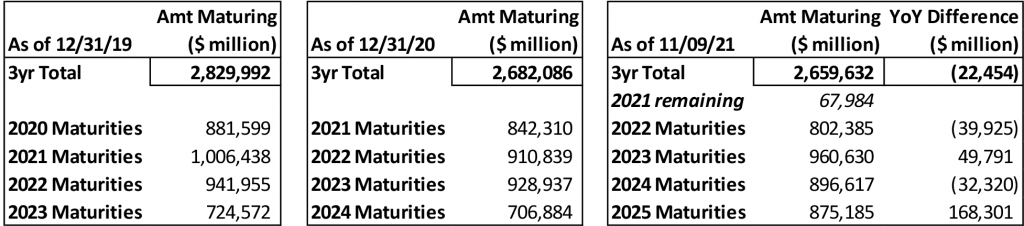
Source: Amherst Pierpont Securities, Bloomberg SRCH function
* * *
Steady demand for yield
Over the past few months, the investment grade credit market has seen a flight to quality with more ‘A’ and ‘AA’ money being put to work. This has compressed the ‘A’ and ‘AA’ curves with little yield pick-up in the front and back end of the curves. However, a need for yield will likely prevail in 2022 especially if the Fed is slow to move on rate hikes. With the stock market at record highs and spreads close to tights, investors will likely look to move down the ratings and credit curve in search of yield.
On fundamentals, fallen angel risk in ‘BBB’ credit is lower now. If a company was not downgraded during the height of the pandemic for credit quality reasons, there is less of a chance of being downgraded as the economy continues to recover. Most investment grade credits in our universe used the pandemic to improve liquidity. While many issued debt at the start of the pandemic, temporarily spiking leverage, most of that debt has been repaid. Furthermore, companies largely suspended shareholder remuneration, which helped build cash on hand. Balance sheets are in better shape today than they were at the start of the pandemic. Any rebound in EBITDA improves credit metrics to levels better than they were in March 2020, thereby providing less downside ratings risk than at the start of the pandemic.
To illustrate the point, S&P recently put out a credit trend report on potential downgrades and upgrades. S&P noted that the gap between downgrades and upgrades is at the lowest level since February 2019 (Exhibit 3). In fact, the number of potential downgrades through September has decreased for 14 consecutive months.
Exhibit 3: S&P gap between potential downgrades and upgrades
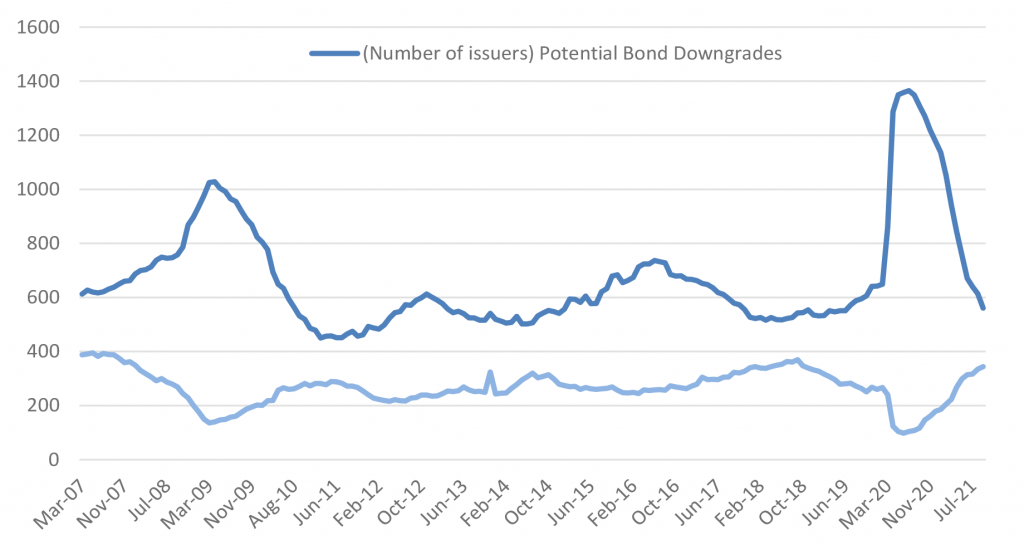
Source: S&P Global Ratings Research; Amherst Pierpont Securities
Looking sector-by-sector basis when assessing ratings risk, S&P went on to break out the number of potential downgrades per sector, per ratings category. Some of the sectors with the least risk of downgrades in the ‘BBB’ category are Healthcare, Capital Goods, Insurance, Metals, Mining & Steel and Aerospace & Defense (Exhibit 4). While we recognize that Technology, Forest and Merchant Power also have minimal ‘BBB’ downgrade risk, they also have ‘A’ exposure, which means a down-in-ratings trade and remaining in investment grade in those sectors is not possible.
Exhibit 4: S&P downgrade potential by sector and ratings category
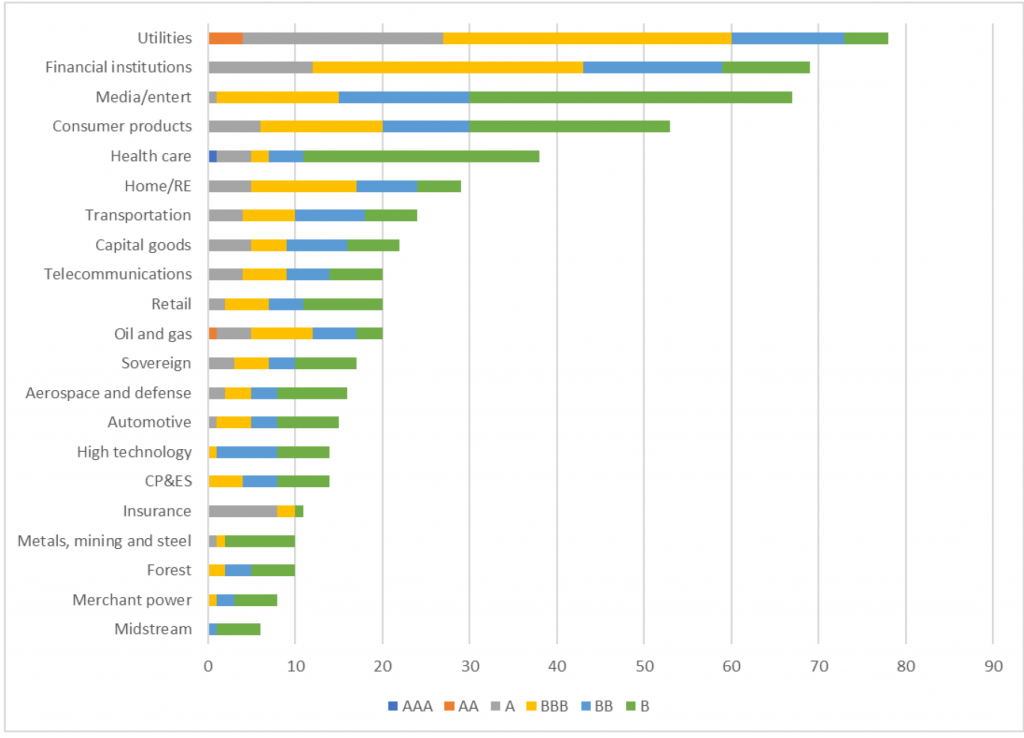
Source: S&P Global Ratings Research; APS
In the Healthcare sector, a down-in-ratings trade that we like is out of Medtronic PLC (MDT – A3/A) 4.375% 2035 bonds and into CVS Health (CVS – Baa2/BBB) 4.875% 2035 bonds for a pick of over 60 bp, while taking out over two points of premium. CVS remains in debt reduction mode since the Aetna acquisition and has already tendered for a portion of this issue. As of the end of 3Q21, CVS has repaid a net total of $18.7 billion in long term debt as they remain committed to a leverage ratio in the low 3.0x area. CVS also raised full year guidance once again, increasing sales, adjusted operating income and EPS.
In the Capital Goods, we view a trade out of Honeywell International Inc. (HON – A2/A/A) into Dover Corporation (DOV – Baa1/BBB+) as attractive. Both credits have similar margin and credit profiles, with EBITDA margins in the 21% area and net leverage in the 1.4x to 1.5x range. Both have been acquisitive but have been using tuck-in acquisitions for growth. We think DOV’s ratings are constrained given the size of the company, as DOV generates less than $10 billion in revenues annually. From a credit perspective, DOV’s total leverage is a full turn lower than that of HON (2.0x versus 3.0x). DOV paper is a little hard to source but trades at a sizeable discount to HON. DOV’s 2.95% 2029 trades roughly 30 bp-35 bp wide to HON 2.7% 2029 paper while in the 20year part of the curve, DOV trades roughly 50 bp wide to HON. DOV has not tapped the market since 2019 and has a few high coupon issues that could be targeted in a refinancing.
* * *
Global corporate M&A should remain highly elevated throughout 2022
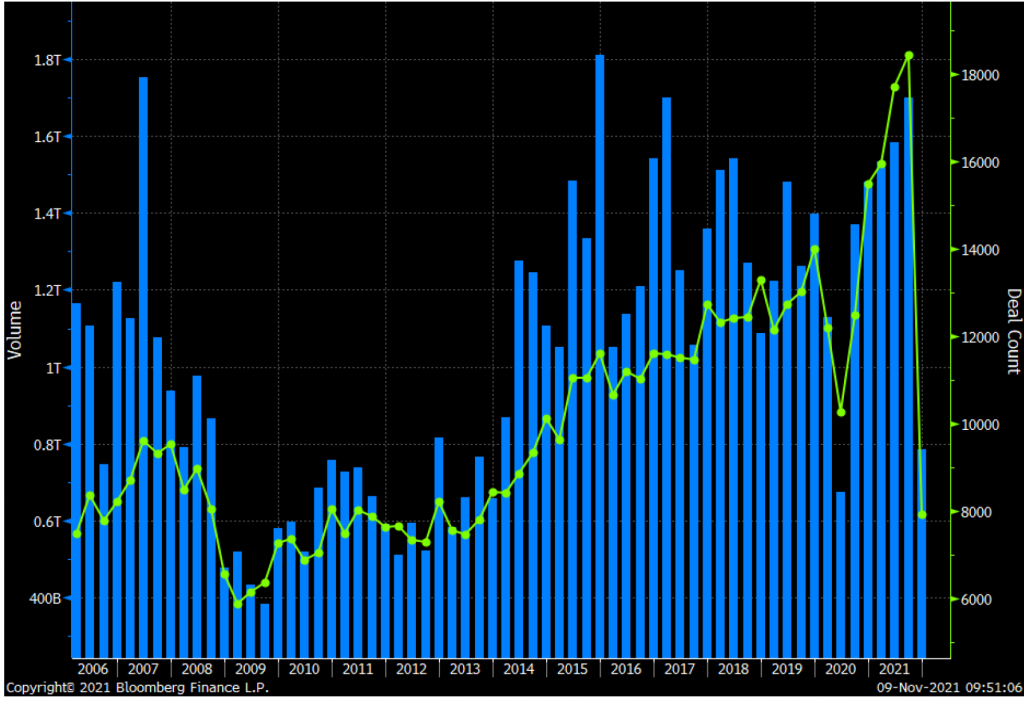
M&A volume reached its highest quarterly level since 2017 in the third quarter of this year while global deal count peaked at record highs (Exhibit 5). These levels of activity should be sustainable through early 2022, as the climate for large M&A appears attractive. Specifically, corporate balance sheets are flush with cash, access to debt capital remains extremely accommodative, and sales growth is likely waning with the recovery from 2020 now fully captured (Exhibit 6, Exhibit 7, Exhibit 8). Many corporate balance sheets have plenty of capacity to add leverage after using recent debt proceeds to term out upcoming maturities and bolster their liquidity profiles. Furthermore, systemic corporate net leverage is running at 10-year lows, giving management teams incentive to pursue debt-funded M&A to fuel growth.
Exhibit 5: Global M&A volume and deal count
Source: Bloomberg
Exhibit 6: Corporate balance sheets are flush with cash
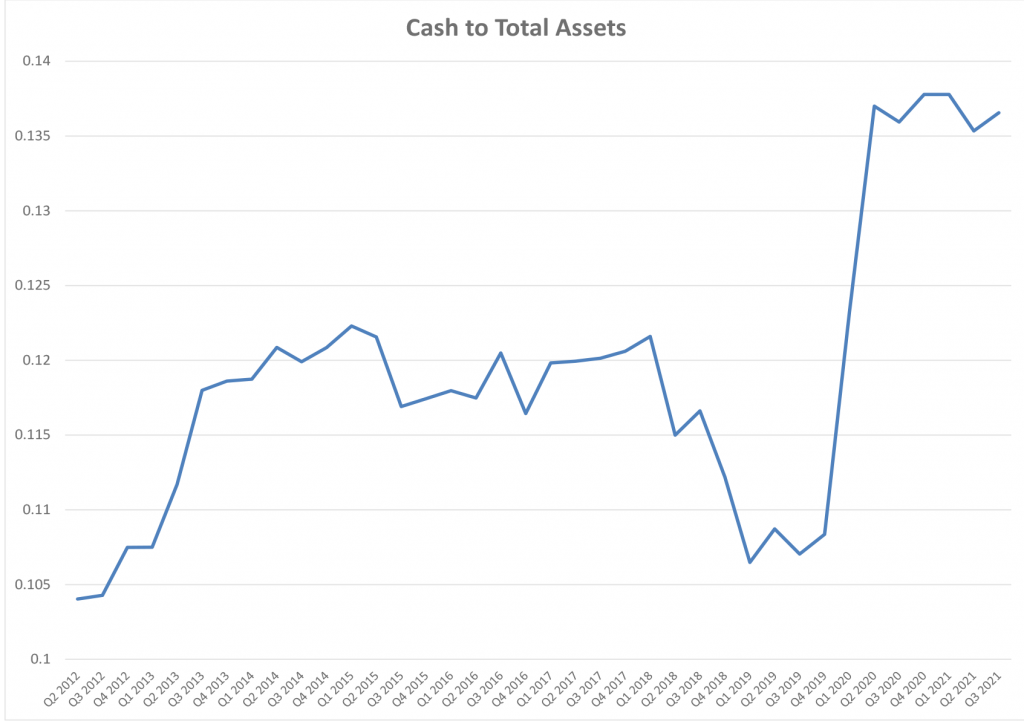
Source: Bloomberg, S&P 500 aggregate statistics
Exhibit 7: Aggregate corporate net leverage hits the lowest level in a decade
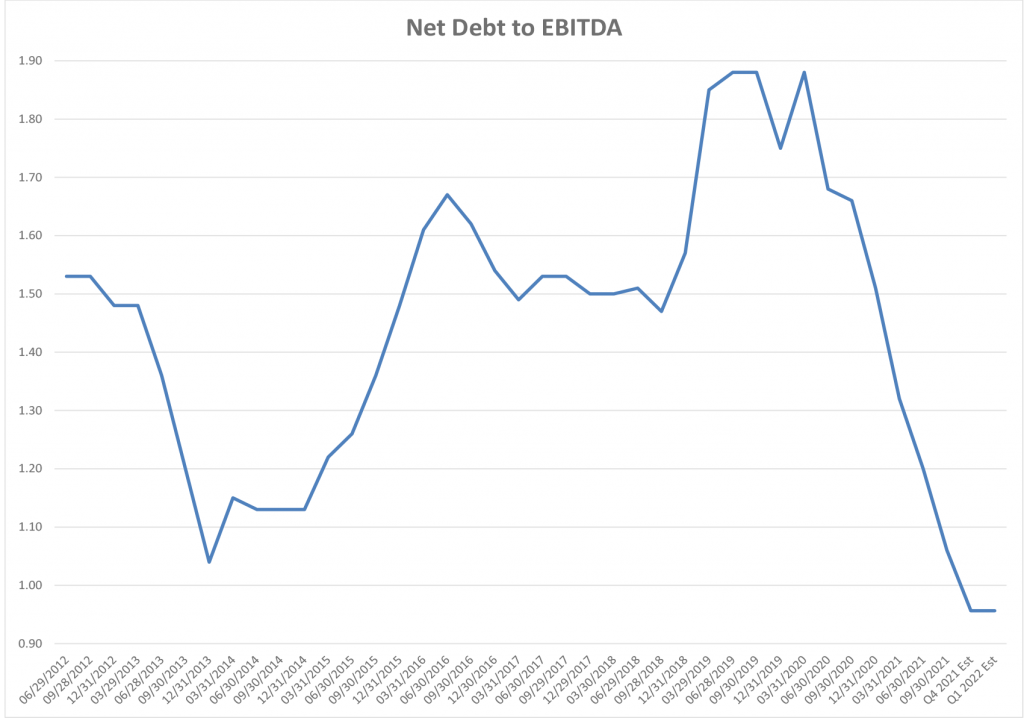
Source: Bloomberg, S&P 500 aggregate statistics
Exhibit 8: A slower rate of sales growth in 2022 is more conducive to M&A deals
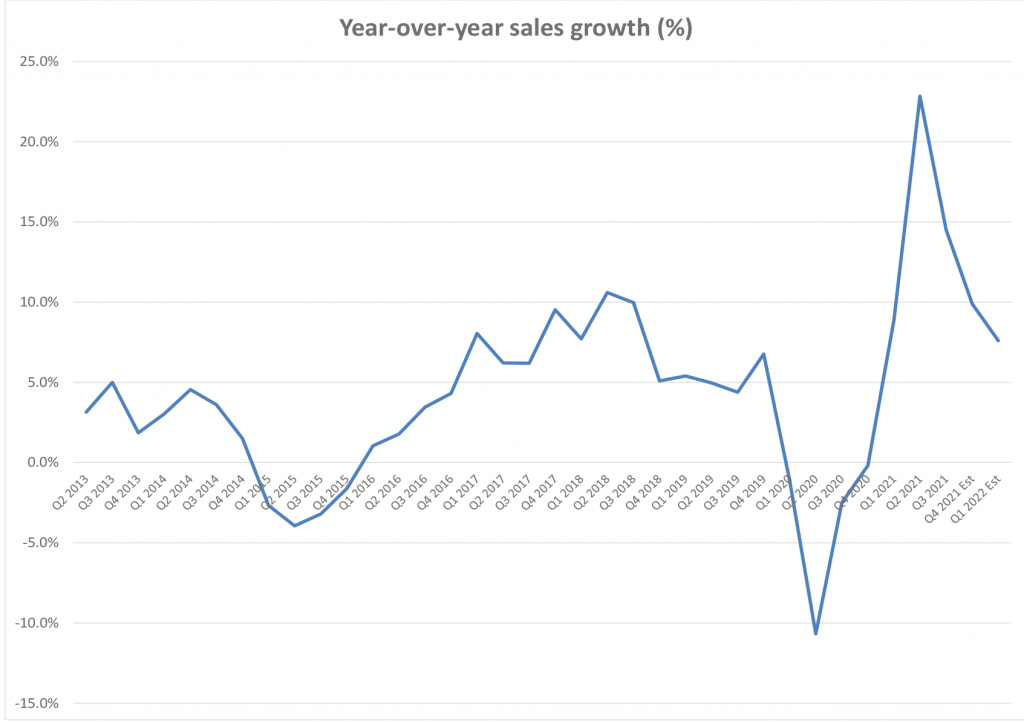
Source: Bloomberg, S&P 500 aggregate statistics
In the financial sector, we have already been highlighting the ongoing trend of US regional bank mergers, which should continue at a solid pace into 2022 (APS: M&A Landscape for Regional Banks). US banks with $20 billion to $100 billion in total assets will continue to garner interest from peer banks as well as larger suitors in both the US and abroad – although it does seem that foreign banks may be cashing out on their US investments in wake of the BBVA USA and MUFG Union bank deals. Also in the financial sector, we have seen some evidence of a pick-up in activity in the Insurance and REITs segments, with several high profile deals such as Chubb’s (CB: A/A+) pursuit of Hartford Financial Services (HIG: Baa1/BBB+) in P&C insurance and Realty Income’s (O: A3/A-) successful purchase of peer Vereit (VER), both announced over the past year, and both of which could portend further activity in each of those respective segments.
On the industrial side, technology and packaged food are ripe for consolidation in 2022. Technology balance sheets are flush with cash, while stocks are near all-time highs providing for strong acquisition currency in addition to low interest rates. We think the semiconductor space may look to combine as chip shortages have caused chipmaker’s P/Es to hover close to the lows seen at the start of the pandemic and underperform their software and hardware technology peers. The acquisition strategy may be one where they look to buy companies with a different area of expertise to capitalize on additional growth pillars. Qualcomm (QCOM – A2/A-) recently announced an extension of its partnership with BMW to collaborate on automated driving systems.
The pandemic proved beneficial for packaged food credits as most were digesting their latest round of acquisitions and looking to delever. Pantry stocking led to stronger than normal top line and cash flow growth, enabling many credits to hit their leverage targets sooner than expected. But organic growth is expected to normalize in 2022 and likely be in negative territory from a year-over-year perspective. In normalized periods organic growth for packaged food is typically in the flat to 1% range. Acquisitions are not only used for top line growth but for synergies to improve margins. This could prove beneficial if packaged food companies see any pushback from the consumer over increased pricing due to inflation.
Worth noting are the 2021 high profile break-ups of companies General Electric (GE: Baa1/BBB+*-/BBB) and American International Group (AIG: Baa2/BBB+*-/BBB+*-); which have long been gesticulating and go against the consolidation trend in the broader corporate sector. It is entirely possible that other conglomerate credits follow suit, but we largely think this will be more of an exception than the rule, and a reflection of a bygone approach to each of their respective markets. In the end, the separate components of each of those businesses (Aviation, Healthcare and Energy in the case of GE, and Life and P&C in the case of AIG) will very likely be more inclined to eventually pursue growth strategies (that include potentially large-scale M&A) once they become independent operating entities.
* * *
Consumer will be in a weaker position in 2022
As the recovery from the height of the COVID-19 pandemic continues it appears the consumer is flush with cash and ready to spend akin to the roaring 1920’s, which coincidentally followed the Spanish flu pandemic. Earnings results largely have exceeded Street estimates, fueling the stock market to continue its torrid pace higher, setting record highs on what seems like a daily basis.
But lurking beneath lies inflationary pressures that have been characterized as transitory, largely due to supply chain issues that started during the pandemic. However, we believe that inflation is likely to stick around longer than expected. Our chief economist, Stephen Stanley, argues inflation will moderate next year but remain elevated. And inflation markets currently price in 2-year average inflation above 3%. Third quarter earnings calls have largely been touting the same theme, that a high pace of inflation is expected to persist through 2022, leaving management teams to delicately balance price hikes and cost cuts to preserve margins. Price hikes on non-discretionary items like food, which is already up 40% since the pandemic started, will only limit the consumer’s spending ability as the year progresses, forcing the consumer to look for ways to make the dollar stretch (Exhibit 9). Furthermore, as the world reopens, consumers will need to go back to spending on things that were curbed during the pandemic, such as commuting, leaving even less for non-discretionary goods. With daily national average gasoline prices up roughly 52% year-to-date and 56% since pandemic started, that begins to eat away at monthly budgets once commuting resumes (Exhibit 10).
Exhibit 9: UN food and agriculture world food price (1/1/20-10/31/21)
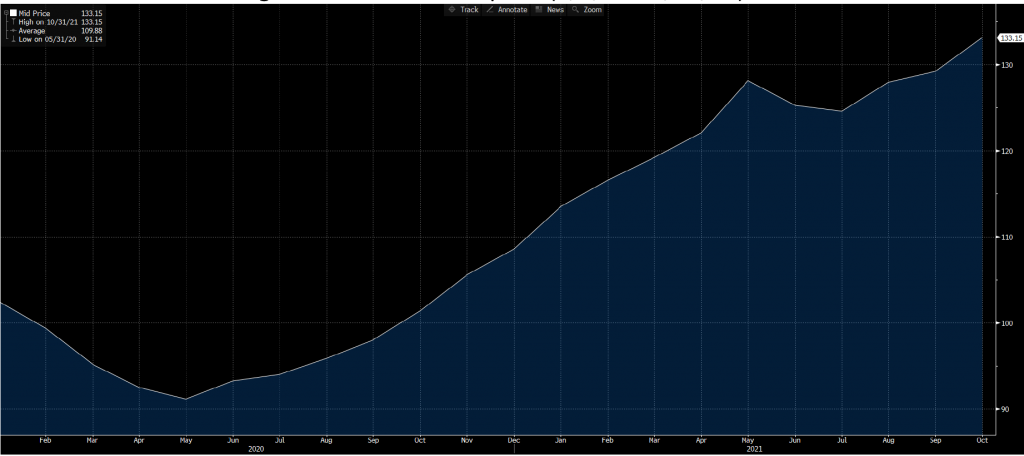
Source: FAOFOODI Index; Bloomberg; APS
Exhibit 10: Daily national average gasoline prices (3/18/20-11/17/21)
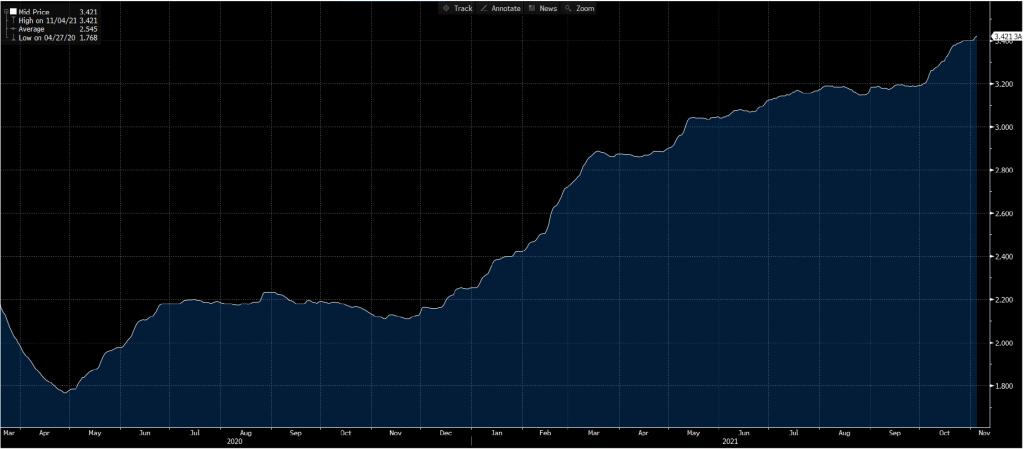
Source: 3AGSREG Index; Bloomberg; APS
The Consumer Sentiment Index is now lower than it was when the pandemic started and has hit its lowest level in nearly a decade (Exhibit 11). Savings accumulated during the pandemic are likely to dwindle as everything will cost more next year including necessities such as energy and food. Barring an offsetting increase in wages or other income, the consumer will actually be in a weaker position in 2022. The consumer will need to make the dollar stretch, which is likely to lead to increased consumer spending at mass merchants, dollar stores and off-price retailers.
Exhibit 11: University of Michigan Consumer Sentiment Index
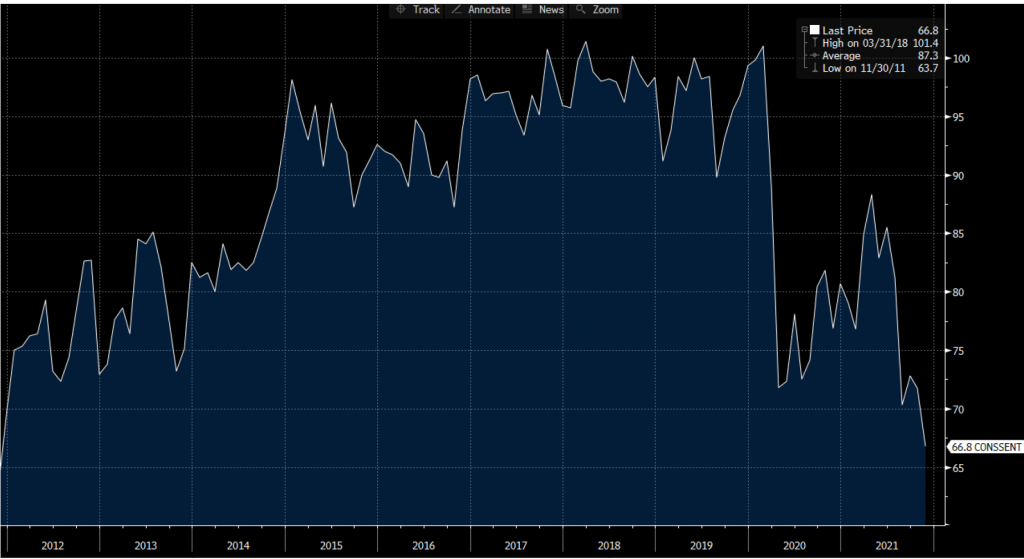
Source: CONSSENT Index; Bloomberg; APS
While dollar stores such as Dollar General (DG – Baa2/BBB) and Dollar Tree (DLTR – Baa2/BBB) do not have very large capital structures, their bonds should be a core holding in an inflationary environment. The value proposition for the consumer is compelling and given that both companies have spent the past decade increasing their percentage of consumables, they provide an important alternative to grocery stores for both perishable and non-perishable items. Additionally, both companies have increased their merchandise to include multi-price items which has resonated well with the customer base, especially for discretionary items. DLTR has been rolling out its Dollar Tree Plus initiative and remains on track to have the multi-price assortment in 500 stores by year-end. By year-end 2024, DLTR plans to have at least 5,000 Dollar Tree Plus stores. Management has noted that Dollar Tree Plus stores have experienced an overall sales and gross profit lift of 6% and an improved cash contribution of roughly 13%. DG is adding pOpshelf locations which have most items priced at $5 or less. DG is focusing on adding a total of 50 pOpshelf locations by year-end as these stores have also exceeded expectations on both sales and gross margin.
Of the two credits, we prefer the DLTR name given the company’s stronger credit profile and that it trades wide to DG. DLTR has been focused on repaying debt since its acquisition of Family Dollar in 2015 and has repaid nearly $5.8 billion since the close. Net adjusted leverage is expected to remain between 2.0x to 2.5x compared to DG’s net adjusted leverage, which has been maintained between the 2.5x-3.0x area. Furthermore, all of DLTR’s issues are $1 billion or more which makes them more liquid than its peer. DLTR’s longest dated issue is its 4.2% 2028 bond which trades roughly 15 bp (g-spread) behind DG’s 4.125% 2028 bond (Exhibit 12). This differential should collapse to 5 bp or less. For those looking to extend out the curve, we recommend the DG 4.125 2050 bonds which are trading at roughly +118 bp (g-spread).
Exhibit 12: DG and DLTR spread curve
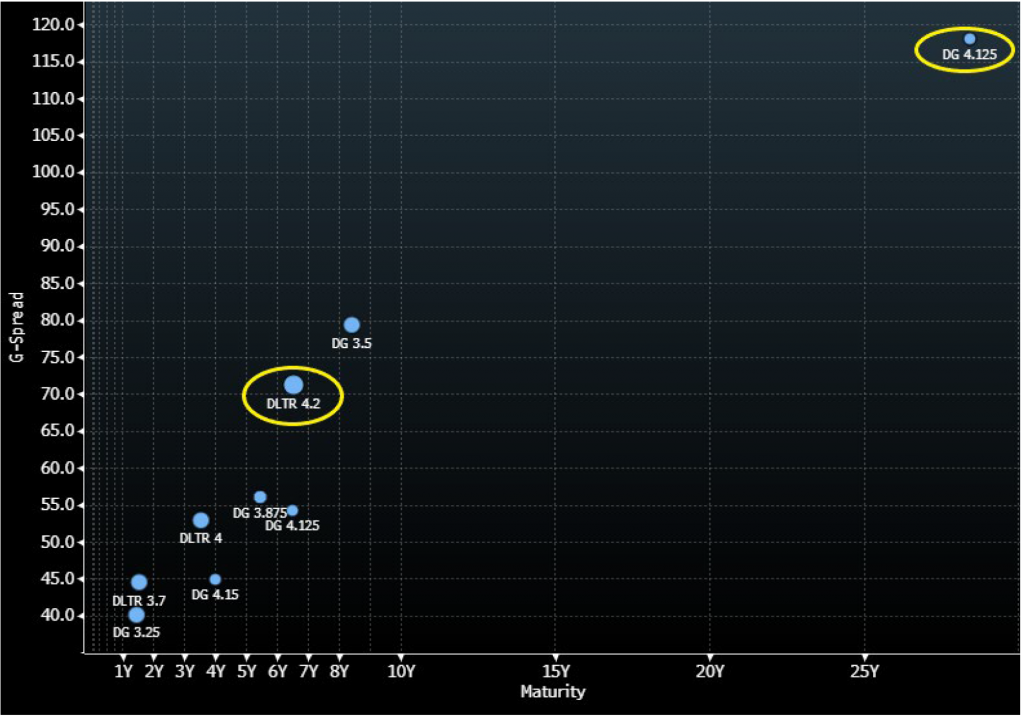
Source: Bloomberg TRACE; APS
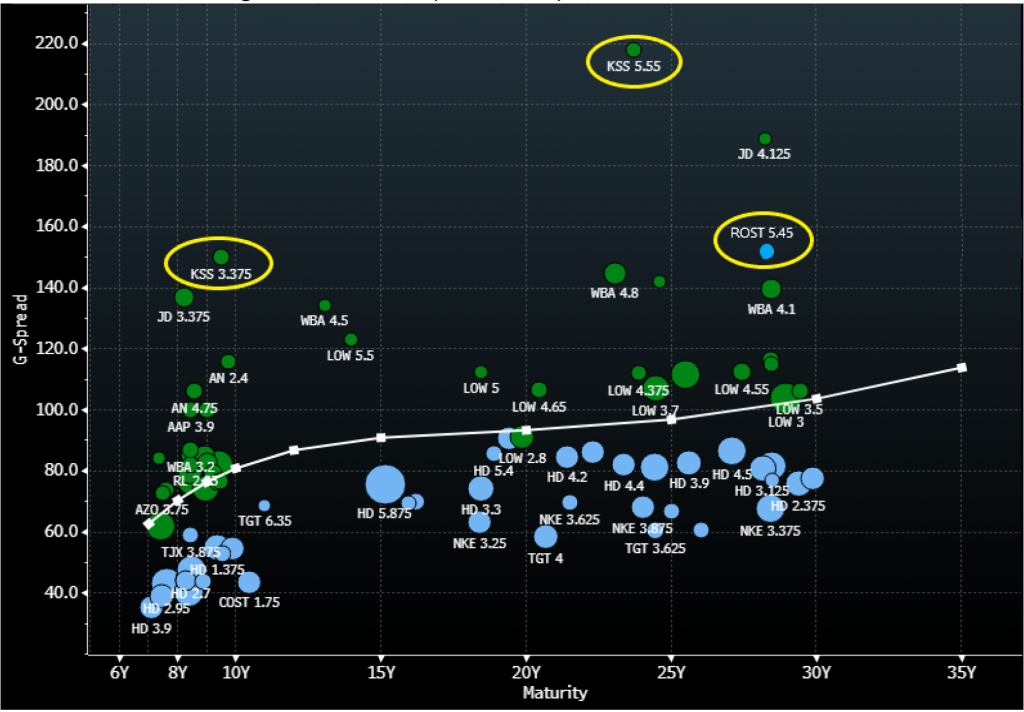
Ross Stores (ROST – A2/BBB+) remains our top pick in the off-price retail space, and we are particularly fond of the 30-year part of the curve. While investors have historically shied away from 30-year brick-and-mortar paper, the pandemic has taught us that brick-and-mortar is not dead. ROST does not even have an online presence, yet LTM sales are now above those posted pre-pandemic. For the full fiscal year ending 1/31/22, sales are estimated to grow approximately 48% yoy. While ROST 30-year bonds are hard to source, especially since the company has tendered for some of the paper, at a spread of 150 bp, they are attractive (Exhibit 13). Additionally, ROST trades roughly 30 bp behind TJX in the 10-year part of the curve, which we expect to collapse closer to 10 bp.
Department stores are not necessarily the place to make a dollar stretch but when it comes to looking for bargains, Kohl’s (KSS – Baa2/BBB-/BBB-) promotional strategy may serve them well. Early Black Friday deals are currently running through most of November. KSS was the only department store that was able to hold on to their investment grade ratings from the disruption caused by the pandemic, as the company has maintained a conservative balance sheet and continued to focus on debt reduction. Furthermore, good inventory management has led to less clearance merchandise, thereby aiding better than expected margin improvement. In fact, Street estimates have KSS ending the fiscal year with an EBITDA margin of 12.6%, 40 bp higher than fiscal 2019. Given the debt reduction, KSS has only one bond in its capital structure that has not been tendered, its 3.375% 2031, currently trading at a spread in the 150 bp area, one of the widest trading investment grade retailers. If investors can source the 5.55% 2045 bonds, those look as attractive as well given that they are trading at a spread in the 220 bp area.
Exhibit 13: Investment grade retail curve (‘A’ to ‘BBB’)
Source: Bloomberg TRACE; APS
* * *
Demand for yield will continue to support down-in-structure trades in banking in the first half of 2022
The banking sector has significantly underperformed the broad investment grade corporate bond index in 2021 year-to-date. As of this publication, banking has recorded an excess return of 1.51% on 27 bp of net OAS tightening year-to-date. That compares with a positive 2.78% excess return for the broad investment grade index on 34 bp of net OAS tightening year-to-date. On a total return basis, banking has recorded a -1.35% return year-to-date compared to -1.02% for the broad index. In 2021, investors have sought higher yielding opportunities in other segments of the market, including energy, finance companies, and REITs.
For 2022, we are maintaining our market weight on the banking sector, with a preference for large US money center banks and Yankee banks over regionals. The exception is in mid-sized and smaller regional banks with $20 billion to $100 billion total assets, where we see opportunity for M&A upside in credit spreads (APS: M&A Landscape for Regional Banks). Furthermore, we see better opportunity for investors to target down-in-structure trading strategies in the banking sector, including trades into subordinated Tier 2 and Tier 1 structures, as well as preferred securities, as liquidity permits. In the latter portion of 2021, we have seen an uptick in preferred issuance; and while spreads may be near historical tights compared to senior ranked securities, we believe preferred and subordinated debt will continue to outperform senior structures, particularly in the front half of 2022. Credit and operating fundamentals remain extremely solid for the broad banking sector, despite some of the operational challenges that confronted the industry throughout 2021 and remain as obstacles for the coming year.
A flatter spread curve implies limited opportunity in taking on duration risk, suggests further credit risk-taking (Exhibit 14).
Exhibit 14: US bank yield curve against Treasuries: current vs year-end 2020
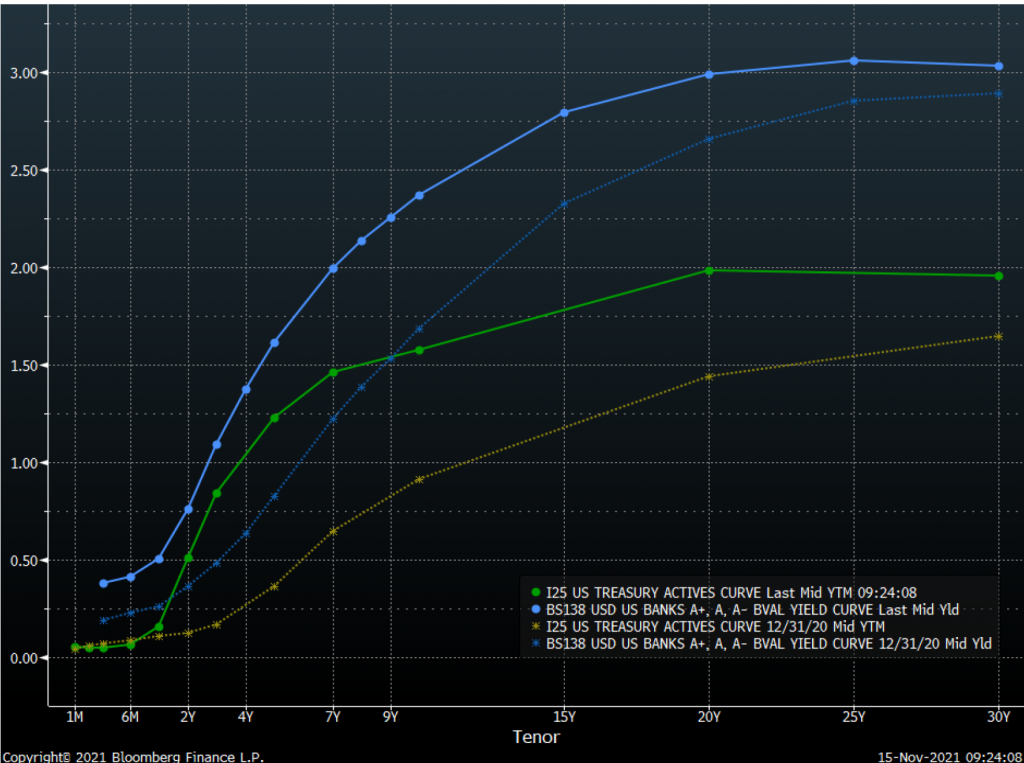
Source: Bloomberg, fair value curves
A material uptick in subordinated debt issuance should come from the big US money center banks in 2022 but anticipate that demand will still significantly outstrip that new supply. Supply of subordinated (Tier 2) notes from the Big 6 US money center banks (BAC, C, GS, MS, JPM, WFC) has been limited in recent years, and is particularly sought after among investors in the secondary market. Issuance of Tier 2 paper had been so aggressive from 2013 to 2016 that the banks have not had a need to issue much over more recent years (Exhibit 15). But now with some of that paper getting closer to regulatory run-off—Tier 2 regulatory capital eligibility amortizes over the final five years to maturity—we could eventually start to see a pick-up in supply among the big banks. We saw a few select Tier 2 debt issues from the US Big 6 in September this year and would expect more to follow in the quarters ahead. Investors should target these deals aggressively, as they remain incredibly difficult to source in the secondary market.
Exhibit 15: Annual debt raised by US banks
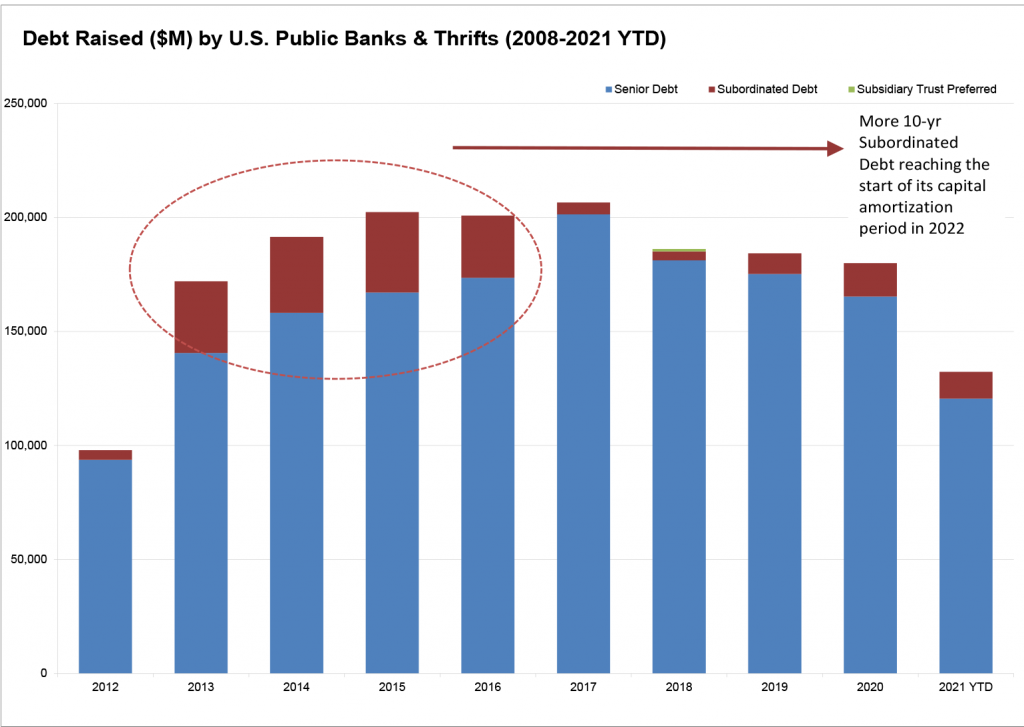
Source: S&P Capital IQ
Moving down the capital structure to preferred debt issues, supply of perpetual instruments from US banks has been consistent over the past three years, giving investors more options of recently issued debt to target in the secondary market (Exhibit 16). Supply should remain consistent in 2022, as demand has enabled US banks to issue into this structure at all-time tight levels relative to senior debt, while satisfying regulatory capital requirements. Nevertheless, we still see good relative value within the segment, and still believe investors should continue to target this structure selectively for added yield in the year ahead.
There is a very strong indirect correlation between the floating rate back-end spread of the preferred instruments and the available yield-to-call, which is inherent to the amount of rate protection afforded to holders and expectations for rates going forward. The more recent issues have had much smaller back-ends and are reflected in current yields. The relative value sweet spot for investors in the secondary market is to selectively target issues with mid-range back-end spreads, offering the best mix of spread over relative seniors and rate protection. Below we highlight some of the securities that fit that description – primarily among the big money center banks with issues outstanding with low-300s back-end, offering mid-3% to 4% yields. Most of these issues are currently trading with G-spread pick-ups of mid-200s over relative senior unsecured 5-year securities, which we still view as offering good risk compensation to investors.
Exhibit 16. US bank preferreds issued over the past three years
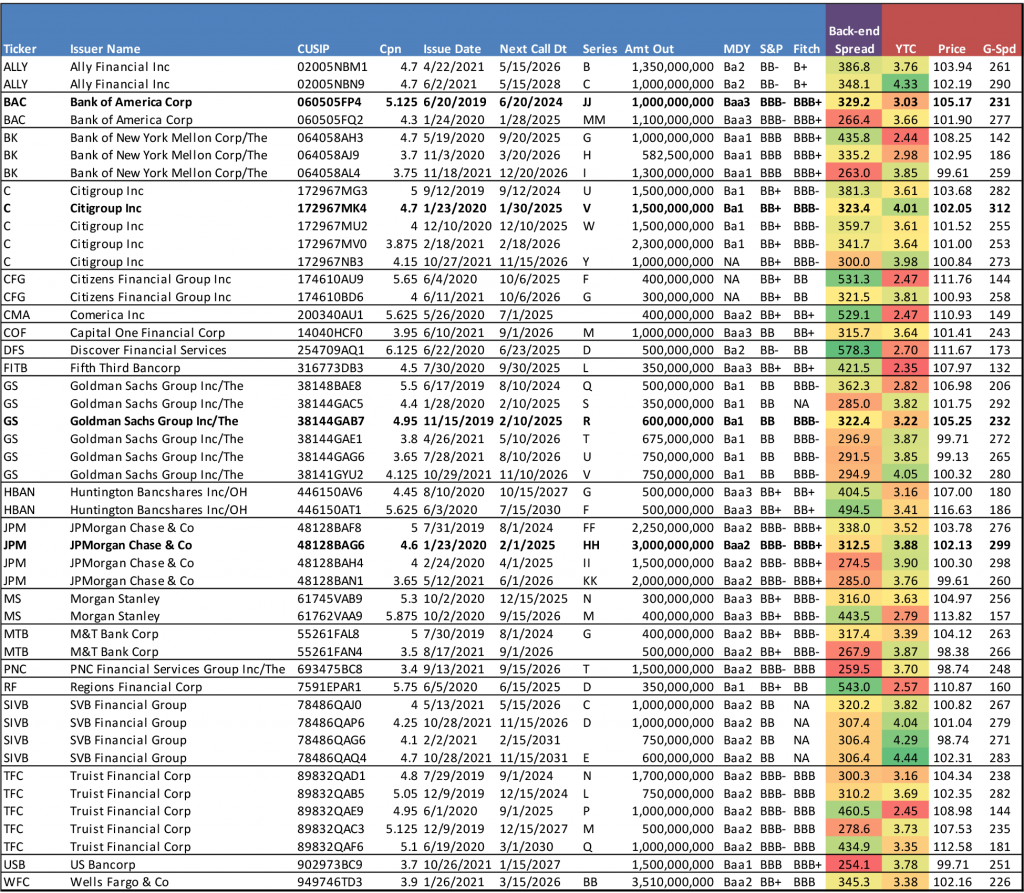
Source: Bloomberg/TRACE BVAL indications only
Outside of US in Yankee banks, subordinated structure trades have also gotten back to historic tights relative to their respective senior level securities, but still offer investors the most attractive path to outperformance in 2022. It is worth looking at the spreads of the Markit iTraxx Europe Senior Financial index to the Markit iTraxx Europe Subordinated Financial Index over the past five years (Exhibit 17). The spread demonstrates the relationship between the two measures is trending toward the recent pre-pandemic tights. Still, in the persistently low-rate environment, even amidst Fed liftoff, investors should continue to target subordinated categories of debt among non-US banks in the first half of 2022.
Exhibit 17: Senior/Subordinated spread in European credit trending toward recent historic tights
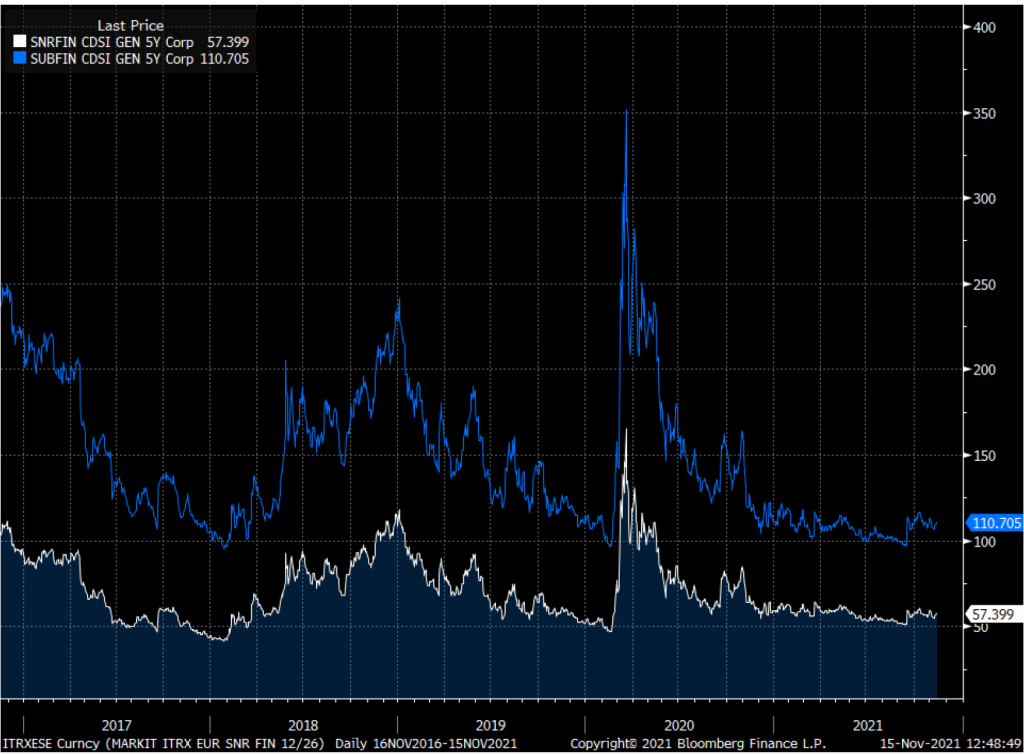
Source: Bloomberg, Markit iTraxx Europe Senior Financial and Senior Subordinated indices
One area where we see particularly good value is among the Big 4 Australian banks’ subordinated (Tier 2) debt issues (Exhibit 18). The banks are fundamentally sound and extremely well capitalized with ‘AA’ ratings from Moody’s and S&P. We like this particular structure because according to Australian bank law, as laid out by the Australian Prudential Regulation Authority (APRA), Tier 2 debt is the senior-most debt that qualifies as TLAC eligible. This is unlike most other banking regimes where there is a “Tier 3” level of eligible debt, typically designated as either senior non-preferred debt or senior holding company debt, depending on the type of bank structure enforced by regulators. The subordinated debt is rated six notches below the senior bank level at Baa1/BBB+ for all four of the Australian pillar banks; but again, the debt is not subordinated to another senior tier of debt that qualifies as TLAC eligible. As an example, 10-year fixed CBAAU subordinated paper is trading at a spread of 125 bp to 130 bp to the curve versus the CBAAU senior bank paper trading at a spread of 60 bp to the curve, offering about 65 bp to 70 bp to effectively move only one level down in the capital structure. That is tight historically but attractive relative to the limited opportunities elsewhere in IG corporate credit. Similarly, WSTP 10NC5 subordinated paper is trading at a roughly 90 bp pick-up to 5-year senior bullets.
Exhibit 18: USD Australian Subordinated Debt (Tier 2)
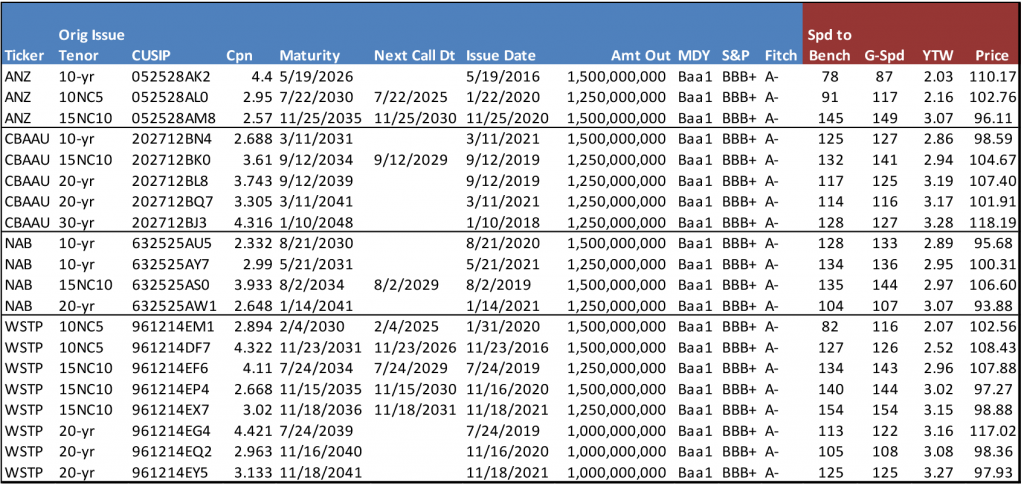
Source: Bloomberg/TRACE spread indications as of 11/15/21
* * *
Inflation does not go away next year, and credit picking comes back in to play
The most recent round of earnings results has seen a majority of beats on both the top line and EPS. Earnings calls have largely been centered around the inflation story and more management teams are expecting inflationary pressure to persist at least through 2022. We have even heard management teams note that they are effectively handling inflation well, with both price hikes and cost cuts. However, margins seem to be telling a much different story. Inflation is not only going to last longer than previously anticipated but the rate of increase is much higher than most management teams have modeled. We have not seen this pace of inflation in the past 20 years (Exhibit 19). Our chief economist, Stephen Stanley, argues inflation will moderate next year but remain elevated. And inflation markets currently price in 2-year average inflation above 3%.
Price hikes have not kept up with the pace of inflation, which will lead to additional rounds of price hikes. Furthermore, most companies used the height of the pandemic to execute significant cost cuts as there was no way to predict just how long the pandemic was going to last. It is going to be harder for management teams to use cost cutting as an effective inflation management tool as most of the “low hanging fruit” is gone.
Exhibit 19: CPI Index (10/31/2000-10/31/21)
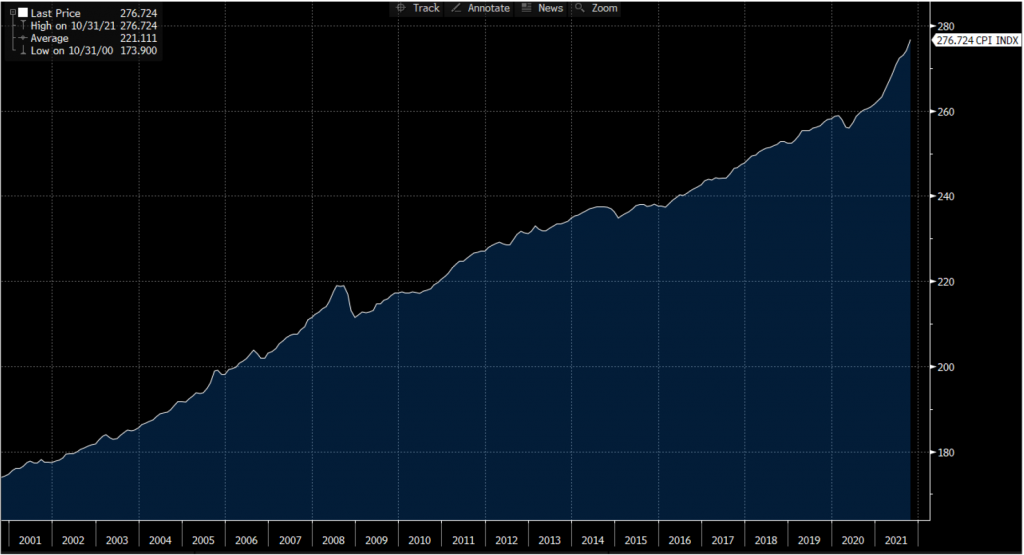
Source: CPI Index; Bloomberg; APS
Additionally, 2021 was essentially a one-way trade tighter as the recovery took hold and market technicals were in play. The credit market in 2021 can be characterized by little volatility for most of the year and large amounts of cash on the sidelines that needed to be put to work. Investors were looking for both yield and tradeable blocks of bonds. Yield bogeys declined as the year wore on but demand for paper remained strong pushing Investment Grade spreads close to pre-pandemic levels. The IG CDX index is only 6 bp wider than where it was on January 2, 2020. Volatility is likely to tick up this year as inflation creeps higher, which should bring relative value back into focus.
As we wade through numbers and rhetoric of earnings releases, we have witnessed credits who have been early and aggressive on price hikes and others who lagged their peers. It is likely to be hard to execute multiple price hikes through 2022 as the consumer begins to push back or look for alternatives. Companies that were more aggressive on price hikes earlier, will have an easier time managing their margin profiles than those who were not. We compiled a handful of credits and an appropriate sector peer that highlights how companies are managing cost inflation better than others. We used a 2-year comparison as we felt that comparing to a quarter during the height of the pandemic was not an accurate representation of margins (Exhibit 20). The comparison leads to several trade ideas:
Exhibit 20. Margin comparison
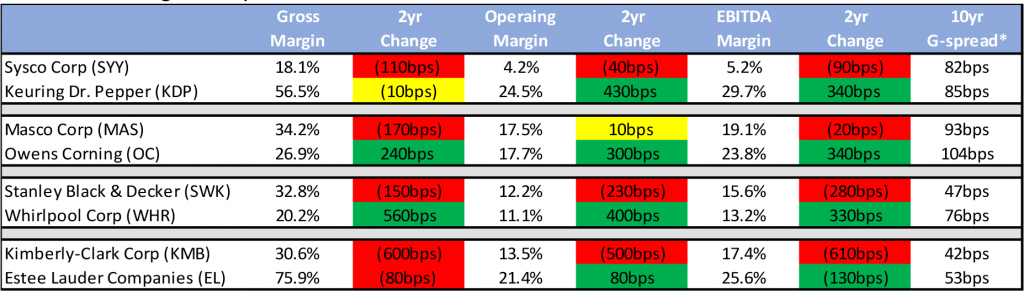
*As of 11/17/21
Source: Company reports; APS
Swap 1: Sell SYY, buy KDP
SYY (Baa1 (n)/BBB/BBB(n)) witnessed a rate of inflation of 13% in 3Q, which came in much higher than expected. Members of management noted that they expect a similar rate of inflation for the current quarter. Furthermore, any taper to inflation is not expected to happen until later in 2022 and much later than what the company had previously modeled. Given the dynamic operating environment, management did make note that it is hard to predict when inflation is going to moderate. While SYY plans to pass through the majority of cost-of-goods inflation, the company commented that continued double-digit inflation is bad for the industry as it will force it to push back on suppliers or find alternate suppliers. However, the supply chain bottlenecks may make that somewhat impossible at this point, which is why SYY believes inflation will taper much later than modeled at the beginning of the year. Additionally, SYY discussed that inflation is not only impacting the obvious areas such as meat and poultry, but items such as fats and shortening, which are used to cook most menu items. Currently, KDP 3.2% 2030 bonds are trading roughly 3 bp (g-spread) behind SYY 5.95% 2030 bonds. Given the coupon difference, accounts can take out over 20 points of premium doing that swap.
Swap 2: Sell MAS, buy OC
Both MAS and OC are witnessing higher prices for almost all material input costs, especially around petroleum-based materials, transportation and energy. However, OC was quicker on price realization which more than fully offset double-digit inflation. MAS (Baa2/BBB/BBB) maintains a higher gross margin by over 700 bp, but OC (Baa3/BBB/BBB-(p)) now maintains higher operating and EBITDA margins due to stronger operating controls. OC currently has a positive outlook by Fitch as the company maintained strong performance and its conservative financial profile during the pandemic.
Currently leverage at OC is 1.6x, which is very low for the current low BBB rating and roughly 4 ticks stronger than the 2.0x at MAS. Fitch has noted that an upgrade is on the horizon as it expects OC to keep leverage sustained below 2.5x. OC does maintain a more conservative approach to shareholder rewards than MAS as it has been less aggressive on share buybacks. Furthermore, we note that OC generates stronger free cash flow than MAS as FCF/sales on an LTM basis was roughly 15% versus 10% at MAS. This will help OC to better invest in growth moving forward whether they choose to reinvest in the business or pursue acquisitions. OC 3.875% 2030 bonds currently trade about 11 bp behind MAS 2.0% 2031 bonds. Furthermore, there is a similar pick up in spread in the back end of the curve.
Swap: 3 Sell SWK, buy WHR
SWK (Baa1/A/A-) had much better than expected performance during the pandemic as revenues were flat in 2020 and the EBITDA margin actually expanded, which led to leverage of 2.0x versus expectations of over 3.0x. This can also be said for WHR (Baa1/BBB/BBB) which witnessed significant demand during the pandemic and continued to manage its capital allocation conservatively. WHR has a long track record of stable profitability and credit metrics through business cycles, which is a testament to its ability to manage costs well. Even with a 5% revenue decline in 2020, WHR witnessed EBITDA margin growth of over 200 bp. Additionally, earnings have been outperforming as WHR continues to witness strong margin expansion due to its low fixed cost base. WHR noted in the most recent quarter that raw material inflation (particularly steel and resins) resulted in an unfavorable impact of 650 bp. However, this was fully offset by price/mix and cost productivity initiatives. That said, WHR is now delivering above their long-term EBIT margin target commitments and believe the positive momentum will continue through 2022. Given the ratings differential, we note that the spread pick-up from SWK to WHR is roughly 30 bp.
Swap 4. Sell KMB, buy EL
KMB’s (A2/A (n)) recent results were negatively impacted by significant inflation and supply chain issues. Management noted in July of this summer that they had expected commodity prices to ease in 2H21. However, the easing did not materialize and prices for resin and pulp increased meaningfully in 3Q. Input costs are now expected to stabilize at much higher levels than previously forecast. Key input costs for the year are expected to increase in the $1,400mm-$1,500mm range, up from previous estimates of $1,200mm-$1,300mm. Furthermore, KMB revised downward the cost savings range that it expects to generate from both its FORCE savings program and the global restructuring program initiated in 2018. While the cost savings revision was minimal, as only the high end of the range was reduced, it makes further margin deterioration inevitable.
Furthermore, commodity contracts are getting reset at higher levels and the FORCE savings program was constructed under a much lower cost input. That said, the benefit of the FORCE program will be less than what KMB was able to extract this year. This compares to EL (A1/A+) who was able to fully offset cost inflation with operating cost controls. The EL credit gets an added boost as demand for EL products will increase the more the economy begins to normalize. EL is also a company that tends to do well throughout economic cycles as their products are associated with feeling and looking good and the price point is easier to justify for a non-discretionary item. Despite, EL’s higher ratings, the credit continues to trade behind KMB by roughly 11 bp. Furthermore, EL benefits from a much stronger and more liquid balance sheet as the company currently has roughly $4 billion of cash on hand (relative to $8 billion of debt) while KMB has approximately $286 million of cash compared to $9 billion of debt.